In [1]:
import pandas as pd
import matplotlib.pyplot as plt
import numpy as np
In [2]:
df=pd.read_csv('c:/2/Energy.csv')
df.head()
Out[2]:
In [3]:
DDT = df[['Date','Consumption']]
print(DDT.head())
Moving Range (R) Stretch marks means differences between the values of subsequent quotations
In [4]:
DDT['Cons_diff'] = DDT['Consumption'].diff()  # rozstępy między pomiarami
DDT['Cons_diff'] = abs(DDT['Cons_diff'])   # wartość bezwzględna dla liczby
In [5]:
DDT.head()
Out[5]:
The average moving range and the average of the last 200 measurements
In [6]:
X_men = DDT['Consumption'].tail(200).mean(axis=0)
X_men
Out[6]:
In [7]:
R_men = DDT['Cons_diff'].tail(200).mean(axis=0)
R_men
Out[7]:
In [8]:
DDT['X_men'] = DDT['Consumption'].tail(200).mean(axis=0)
DDT['R_men'] = DDT['Cons_diff'].tail(200).mean(axis=0)
DDT['UCLr'] = 3.27 * DDT['R_men']
DDT['UCLx'] = DDT['X_men'] + (2.66*DDT['R_men'])
DDT['LCLx'] = DDT['X_men'] - (2.66*DDT['R_men'])
DDT.head()
Out[8]:
Standard deviation for the process
In [9]:
DDT['std_T'] = DDT['R_men']/1.128
DDT.tail(2)
Out[9]:
Last 30 measurements
In [10]:
ZZT = DDT.tail(60)
In [11]:
ZZT['Date'] = pd.to_datetime(ZZT['Date'])
ZZT.dtypes
Out[11]:
Individuals Control Chart I-MR
In [12]:
fig, (ax1, ax2, ax3, ax4) = plt.subplots(nrows=1, ncols=4,figsize=(18, 8))

grid = plt.GridSpec(3, 4, wspace=0.4, hspace=0.5)
ax1 = plt.subplot(grid[0, 0])
ax2 = plt.subplot(grid[0, 1:])
ax3 = plt.subplot(grid[1, :1])
ax4 = plt.subplot(grid[1, 1:])


#ax1.plot(ZZT['Consumption'],color='green', alpha=0.8)
#ax1.set_title('Freedom in the world', color='darkblue')
#ax1.set_xlabel('jakaś zmienna')
#ax1.set_ylabel('ogólnie wykres bez sensu', color='brown')

ax2.set_title('Control Chart I-MR', color='darkblue')
ax2.plot(ZZT['X_men'],color='green', alpha=0.8)
ax2.plot(ZZT['UCLx'],color='red', alpha=0.8)
ax2.plot(ZZT['LCLx'],color='red', alpha=0.8)
ax2.plot(ZZT['Consumption'],color='blue', alpha=0.8)
ax2.legend(loc=(0.65, 0.8))
ax2.grid()

#ax3.scatter(ZZT['couns_a_diff'],df['Freedom'],color='blue', alpha=0.8)
ax3.scatter(ZZT['Date'],ZZT['Consumption'],color='red', alpha=0.8)
#ax3.legend(loc=(0.65, 0.8))

ax4.set_title('Moving Range (R)', color='darkblue')
ax4.plot(ZZT['UCLr'],color='brown', alpha=0.8)
ax4.plot( ZZT['Cons_diff'], color='black', alpha=0.8)
ax4.grid()
Individuals Control Chart I-MR
Source of data: https://www.spcforexcel.com/knowledge/variable-control-charts/individuals-control-charts
In [13]:
dk = pd.read_csv('c:/11/ABC.txt')
dk
Out[13]:
Moving Range (R)
In [14]:
dk['point_diff'] = dk['point'].diff()  # rozstępy między pomiarami
dk['point_diff'] = abs(dk['point_diff'])   # wartość bezwzględna dla liczby
Mean and Range (R)
In [15]:
dk['X_men'] = dk['point'].tail(200).mean(axis=0)
dk['R_men'] = dk['point_diff'].tail(200).mean(axis=0)
dk['UCLr'] = 3.27 * dk['R_men']
dk['UCLx'] = dk['X_men'] + (2.66*dk['R_men'])
dk['LCLx'] = dk['X_men'] - (2.66*dk['R_men'])
dk.head()
Out[15]:
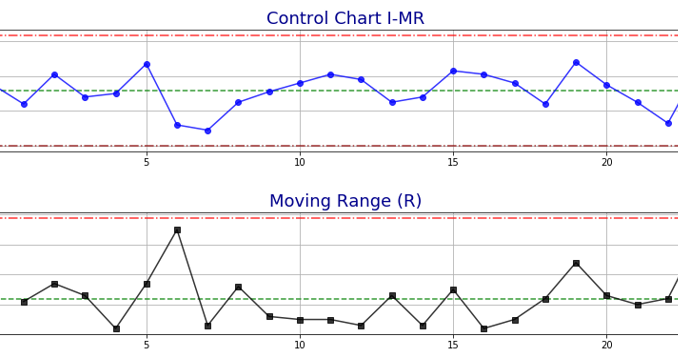
Control Chart I-MR
In [16]:
fig, (ax1, ax2, ax3, ax4) = plt.subplots(nrows=1, ncols=4,figsize=(20, 20))

grid = plt.GridSpec(6, 4, wspace=0.4, hspace=0.5)
ax1 = plt.subplot(grid[0, 0])
ax2 = plt.subplot(grid[0, 1:])
ax3 = plt.subplot(grid[1, :1])
ax4 = plt.subplot(grid[1, 1:])


#ax1.plot(ZZT['Consumption'],color='green', alpha=0.8)
#ax1.set_title('Freedom in the world', color='darkblue')
#ax1.set_xlabel('jakaś zmienna')
#ax1.set_ylabel('ogólnie wykres bez sensu', color='brown')

ax2.set_title('Control Chart I-MR', color='darkblue', fontsize=18)
ax2.plot(dk['X_men'],'--',color='green', alpha=0.8, label='X_men')
ax2.plot(dk['UCLx'],'-.',color='red', alpha=0.8, label='UCLx')
ax2.plot(dk['LCLx'],'-.',color='darkred', alpha=0.8, label='LCLx')
ax2.plot(dk['point'],'go-',color='blue', alpha=0.8, label='x')
#ax2.legend(loc=(-0.15, 0.5))
ax2.grid()
ax2.annotate('UCL', xy=(1,1), xytext=(0.95, 0.89), textcoords='axes fraction', fontsize=18, color='red')
ax2.annotate('LCL', xy=(1,1), xytext=(0.95, 0.07), textcoords='axes fraction', fontsize=18, color='black')
ax2.annotate('mean', xy=(1,1), xytext=(0.95, 0.5), textcoords='axes fraction', fontsize=18, color='green')


#ax3.scatter(ZZT['couns_a_diff'],df['Freedom'],color='blue', alpha=0.8)
#ax3.scatter(ZZT['Date'],ZZT['Consumption'],color='red', alpha=0.8)
#ax3.legend(loc=(0.65, 0.8))


ax4.set_title('Moving Range (R)', color='darkblue', fontsize=18)
ax4.plot(dk['UCLr'],'-.',color='red',alpha=0.8, label='UCLr')
ax4.plot(dk['R_men'],'--',color='green', alpha=0.8, label='R_men')
ax4.plot( dk['point_diff'],'rs-', color='black', alpha=0.8, label='R')
ax4.annotate('mean', xy=(1,1), xytext=(0.95, 0.3), textcoords='axes fraction', fontsize=18, color='green')
ax4.annotate('UCL', xy=(1,1), xytext=(0.95, 0.89), textcoords='axes fraction', fontsize=18, color='red')
#ax4.legend(loc=(-0.15, 0.6))
ax4.grid()

