Perfect Plots: Categorical Plot

In [1]:
import pandas as pd
import matplotlib.pyplot as plt
import seaborn as sns

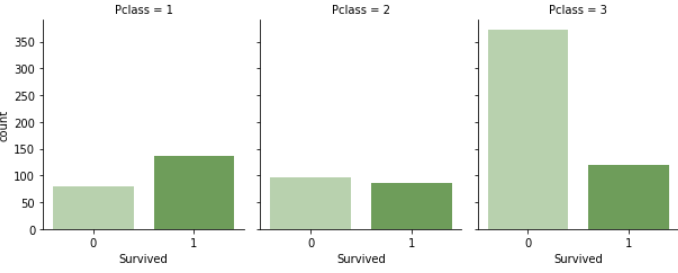
Titanic disaster

Analysis of the categorical results.
We ought to find which passengers have chance to survive according to their affiliation to the established groups.

Source of data: https://www.kaggle.com/shivamp629/traincsv

In [2]:
df = pd.read_csv('c:/1/kaggletrain.csv')
df.head()
Out[2]:
Unnamed: 0 PassengerId Survived Pclass Name Sex Age SibSp Parch Ticket Fare Cabin Embarked
0 0 1 0 3 Braund, Mr. Owen Harris male 22.0 1 0 A/5 21171 7.2500 NaN S
1 1 2 1 1 Cumings, Mrs. John Bradley (Florence Briggs Th… female 38.0 1 0 PC 17599 71.2833 C85 C
2 2 3 1 3 Heikkinen, Miss. Laina female 26.0 0 0 STON/O2. 3101282 7.9250 NaN S
3 3 4 1 1 Futrelle, Mrs. Jacques Heath (Lily May Peel) female 35.0 1 0 113803 53.1000 C123 S
4 4 5 0 3 Allen, Mr. William Henry male 35.0 0 0 373450 8.0500 NaN S
In [3]:
Woj = ['#b6d7a8','#6aa84f']

# Plot
g = sns.catplot("Survived", col="Pclass", col_wrap=4,
                data=df[df.Pclass.notnull()],
                kind="count", height=3.5, aspect=.8, 
                palette=Woj)

plt.show()

Banking marketing

Analysis of the categorical results.
Source of data: https://archive.ics.uci.edu/ml/machine-learning-databases/00222/

In [4]:
df2 = pd.read_csv('c:/1/bank.csv')
df2.head(3)
Out[4]:
Unnamed: 0 Unnamed: 0.1 age job marital education default housing loan contact campaign pdays previous poutcome emp_var_rate cons_price_idx cons_conf_idx euribor3m nr_employed y
0 0 0 44 blue-collar married basic.4y unknown yes no cellular 1 999 0 nonexistent 1.4 93.444 -36.1 4.963 5228.1 0
1 1 1 53 technician married unknown no no no cellular 1 999 0 nonexistent -0.1 93.200 -42.0 4.021 5195.8 0
2 2 2 28 management single university.degree no yes no cellular 3 6 2 success -1.7 94.055 -39.8 0.729 4991.6 1

3 rows × 23 columns

In [5]:
Kot = ['grey', 'red']
plt.figure(dpi= 380)
# Plot
g = sns.catplot("y", col="marital", col_wrap=4,
                data=df2[df2.marital.notnull()],
                kind="count", height=3.5, aspect=.8, 
                palette=Kot,  alpha=0.5, legend=True)

plt.rc("font", size=15)

plt.show()
<Figure size 2280x1520 with 0 Axes>

Clinical tests

Source of data: https://www.kaggle.com/saurabh00007/diabetescsv

In [6]:
df3 = pd.read_csv('c:/1/diabetes.csv')
df3.head(3)
Out[6]:
Pregnancies Glucose BloodPressure SkinThickness Insulin BMI DiabetesPedigreeFunction Age Outcome
0 6 148 72 35 0 33.6 0.627 50 1
1 1 85 66 29 0 26.6 0.351 31 0
2 8 183 64 0 0 23.3 0.672 32 1
In [10]:
kot = ['young patient', 'medium patient', 'senior patient']
df3['Age group'] = pd.qcut(df['Age'],3, labels=kot)
In [11]:
Kot = ['#ff9900', '#783f04']
plt.figure(dpi= 380)
# Plot
g = sns.catplot("Outcome", col='Age group', col_wrap=4,
                data=df3[df2.marital.notnull()],
                kind="count", height=5.5, aspect=.7, 
                palette=Kot,  alpha=0.4)

plt.rc("font", size=14)

plt.show()
C:ProgramDataAnaconda3libsite-packagesipykernel_launcher.py:5: UserWarning: Boolean Series key will be reindexed to match DataFrame index.
  """
<Figure size 2280x1520 with 0 Axes>