import pandas as pd
import matplotlib.pyplot as plt
import numpy as np
import matplotlib.patches as mpatches
Titanic disaster 
Source of data: https://www.kaggle.com/shivamp629/traincsv
In [2]:
df = pd.read_csv('c:/1/kaggletrain.csv')
df.head()
SKS = df.pivot_table(index=['Sex','Age'], values = 'Fare', aggfunc='count').reset_index()
SKS.head()
Out[3]:
In [4]:
fig, ax = plt.subplots(figsize=(6,5), dpi= 80)
import seaborn as sns

# Draw Stripplot

sns.stripplot(SKS.Sex, SKS.Age, size=SKS.Fare*2, ax=ax)

# Decorations
plt.title('Counts Plot - Size of circle is bigger as bigger is subpopulation', fontsize=12)
plt.show()
In [5]:
# Draw Plot
plt.figure(figsize=(6,4), dpi= 80)
sns.violinplot(x=SKS.Sex, y=SKS.Age, data=df, scale='width', inner='quartile')

# Decoration
plt.title('Age of the Titanic passengers by sex', fontsize=12)
plt.show()
In [6]:
PKP = df.pivot_table(index=['Pclass','Sex','Age'], values = 'Fare', aggfunc='count').reset_index()
PKP.rename(columns={'Fare':'Count'}, inplace=True)
PKP.head()
Out[6]:
In [7]:
# Draw Plot
plt.figure(figsize=(6,4), dpi= 80)
sns.violinplot(x=PKP.Pclass, y=PKP.Age, data=df, scale='width', inner='quartile',  palette="husl")

# Decoration
plt.title('Age of the Titanic passengers by sex', fontsize=18)
plt.show()
green = ['#274e13','#6aa84f','#93c47d', '#b6d7a8','#d9ead3','#b7b7b7','#38761d']
cyan = ['#0c343d','#134f5c','#45818e','#76a5af','#a2c4c9','#d0e0e3'] #cyan
yellow = ['#7f6000','#bf9000','#f1c232','#ffd966','#ffe599','#fff2cc'] #yellow
magenta = ['#4c1130','#a64d79','#c27ba0','#d5a6bd','#ead1dc','#741b47',] #magenta
colors = ['#e6b8af','#b6d7a8','#e06666','#747574','#ffd966','#ffcc99','#ea9999']
colors = ['#93c47d','#b6d7a8','#d9ead3','#d0e0e3','#a2c4c9','#76a5af']
purple = ['#c27ba0','#d5a6bd','#ead1dc','#ffffff','#a64d79','#d9d2e9','#b4a7d6'] #purple
blue = ['#cfe2f3','#9fc5e8','#6fa8dc'] #blue
colors = ['#d9ead3','#b6d7a8','#93c47d','#6aa84f']
grey = ['#000000', '#434343', '#666666', '#999999', '#b7b7b7', '#cccccc', '#d9d9d9','#efefef','#f3f3f3']
lightCornflower = ['#1c4587', '#1155cc', '#3c78d8', '#6d9eeb', '#a4c2f4', '#c9daf8', '#4a86e8', '#d9d9d9']

#colors = ['#ff0000','#434343','#666666','#999999','#b7b7b7','#cccccc','#d9d9d9','#efefef','#ffffff','#f3f3f3'] #=> niemieckie czasopismo
In [8]:
blue = ['#cfe2f3','#9fc5e8','#6fa8dc']
sns.violinplot(x=PKP.Pclass, y=PKP.Age, data=df, scale='width', inner='quartile',  palette=blue, alpha=0.1)
# Decoration
plt.title('Age of the Titanic passengers by sex', fontsize=18)
plt.show()
In [9]:
purple = ['#c27ba0','#d5a6bd','#ead1dc','#ffffff','#a64d79','#d9d2e9','#b4a7d6']

sns.violinplot(x=PKP.Pclass, y=PKP.Age, data=df, scale='width', inner='quartile',  palette=purple)
sns.swarmplot(x=PKP.Pclass, y=PKP.Age, data=df, color='lightblue', alpha=0.9)
Out[9]:
In [10]:
df3 = pd.read_csv('c:/1/WorldHappinessReport.csv')
df3= df3[df3['Year']==2017]
df3.head(3)
Out[10]:
In [11]:
NIK = df3.pivot_table(index=['Region','Happiness Score'], values = 'Country', aggfunc='count').reset_index()
print(NIK.head())
REG = NIK['Region'].unique()
In [12]:
plt.figure(figsize=(16,4), dpi= 80)

cyan = ['#0c343d','#134f5c','#45818e','#76a5af','#a2c4c9','#d0e0e3']
sns.violinplot(x=NIK.Region, y=NIK['Happiness Score'], data=df3, scale='width', inner='quartile',  palette=cyan)
sns.swarmplot(x=NIK.Region, y=NIK['Happiness Score'], data=df3, color='white', alpha=0.4)


plt.gca().set_xticklabels(REG, rotation=90, horizontalalignment= 'right', fontsize=18)
plt.title("Happiness Score by regions 2017", fontsize=25, alpha=0.4)
plt.ylabel('Happiness Score')
#plt.ylim(0, 37000)
plt.show()
In [13]:
df4 = pd.read_csv('c:/1/drinksbycountry.csv')
df4.head(3)
Out[13]:
In [14]:
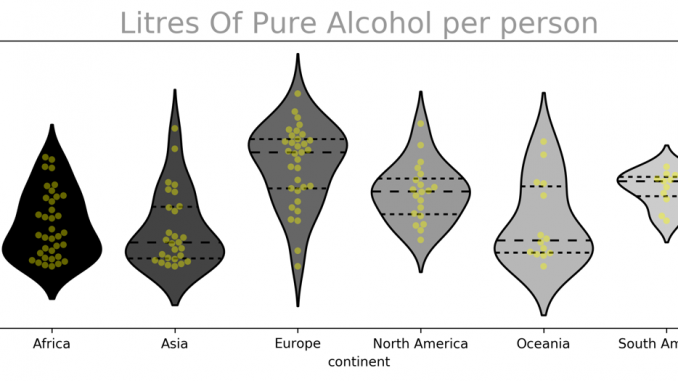
PKS = df4.pivot_table(index =['continent','total_litres_of_pure_alcohol'], values='country' , aggfunc='count').reset_index()
PKS.rename(columns={'country':'count'}, inplace=True)
PKS.head()
Out[14]:
In [15]:
plt.figure(figsize=(10,4), dpi= 280)

grey = ['#000000', '#434343', '#666666', '#999999', '#b7b7b7', '#cccccc', '#d9d9d9','#efefef','#f3f3f3']
sns.violinplot(x=PKS.continent, y=PKS['total_litres_of_pure_alcohol'], data=PKS, scale='width', inner='quartile',  palette=grey)
sns.swarmplot(x=PKS.continent, y=PKS['total_litres_of_pure_alcohol'], data=PKS, color='yellow', alpha=0.4)


#plt.gca().set_xticklabels(xxx, rotation=90, horizontalalignment= 'right', fontsize=14)
plt.title("Litres Of Pure Alcohol per person", fontsize=22, alpha=0.4)
plt.ylabel('counts')
#plt.ylim(0, 37000)
plt.show()
In [16]:
df5 = pd.read_csv('c:/1/imdbratings.csv')
df5.head(3)
Out[16]:
In [17]:
SKO = df5.pivot_table(index=['genre','duration'], values='title', aggfunc='count').reset_index()
KOT = SKO['genre'].unique()
SKO.head()
Out[17]:
In [18]:
plt.figure(figsize=(10,4), dpi= 280)

lightCornflower = ['#1c4587', '#1155cc', '#3c78d8', '#6d9eeb', '#a4c2f4', '#c9daf8', '#4a86e8', '#d9d9d9']
sns.violinplot(x=SKO.genre, y=SKO['duration'], data=SKO, scale='width', inner='quartile',  palette=lightCornflower, markers='d')
sns.swarmplot(x=SKO.genre, y=SKO['duration'], data=SKO, color='black', alpha=0.4)


plt.gca().set_xticklabels(KOT, rotation=90, horizontalalignment= 'right', fontsize=14, color='#45818e')
plt.title("Duration films by genre", fontsize=22, alpha=0.4)
plt.ylabel('Duration')
#plt.ylim(0, 37000)
plt.show()


