

Start
I graduated quantity methods at Nicolas Copernicus University at Thorn. My license work was Random walk model that made prediction of future prices of stock on the base of prices from yesterday adding a noise (white noise).
I started write doctorate in the quantity modeling: Markowitz missile (dissertation). I didn't finish it. After graduation the school I was working as financial analyst, controller and as financial officer. I was working even in Hard Rock Cafe as Financial Director. When I was working for France Telecom subsidiary in Warsaw. I was remarked by management and was sent me at the special, many weeks course. I was become Black Belt Six Sigma with own process, improvement projects and quantity tools. I was owner of human resource process and work time calendar.
I again back to the finance but I established my own one person company. I was realized orders in area of quantitative management.
Hard Rock Cafe
 I was CFO in Warsaw Hard Rock Cafe. Most time I devoted on financial reporting, accountant and management. In HRC I also, partly was working in modeling and estimation. I was detecting frauds in alcohol selling. At night barmen were selling drinks without bill. They took the money in their pockets. I was detecting frauds in alcohol selling. At night barmen were selling drinks without bill. They took the money in their pockets. We know it because we made stocktaking every time after night shift. Not all barmen, but couple of them was cheating. Indication who was cheating was difficult, because barmen working in mixed teams. I used theory of probability. Answered the question: What is the likelihood for each barman per quantity of inconsistent.
Bakery retail net
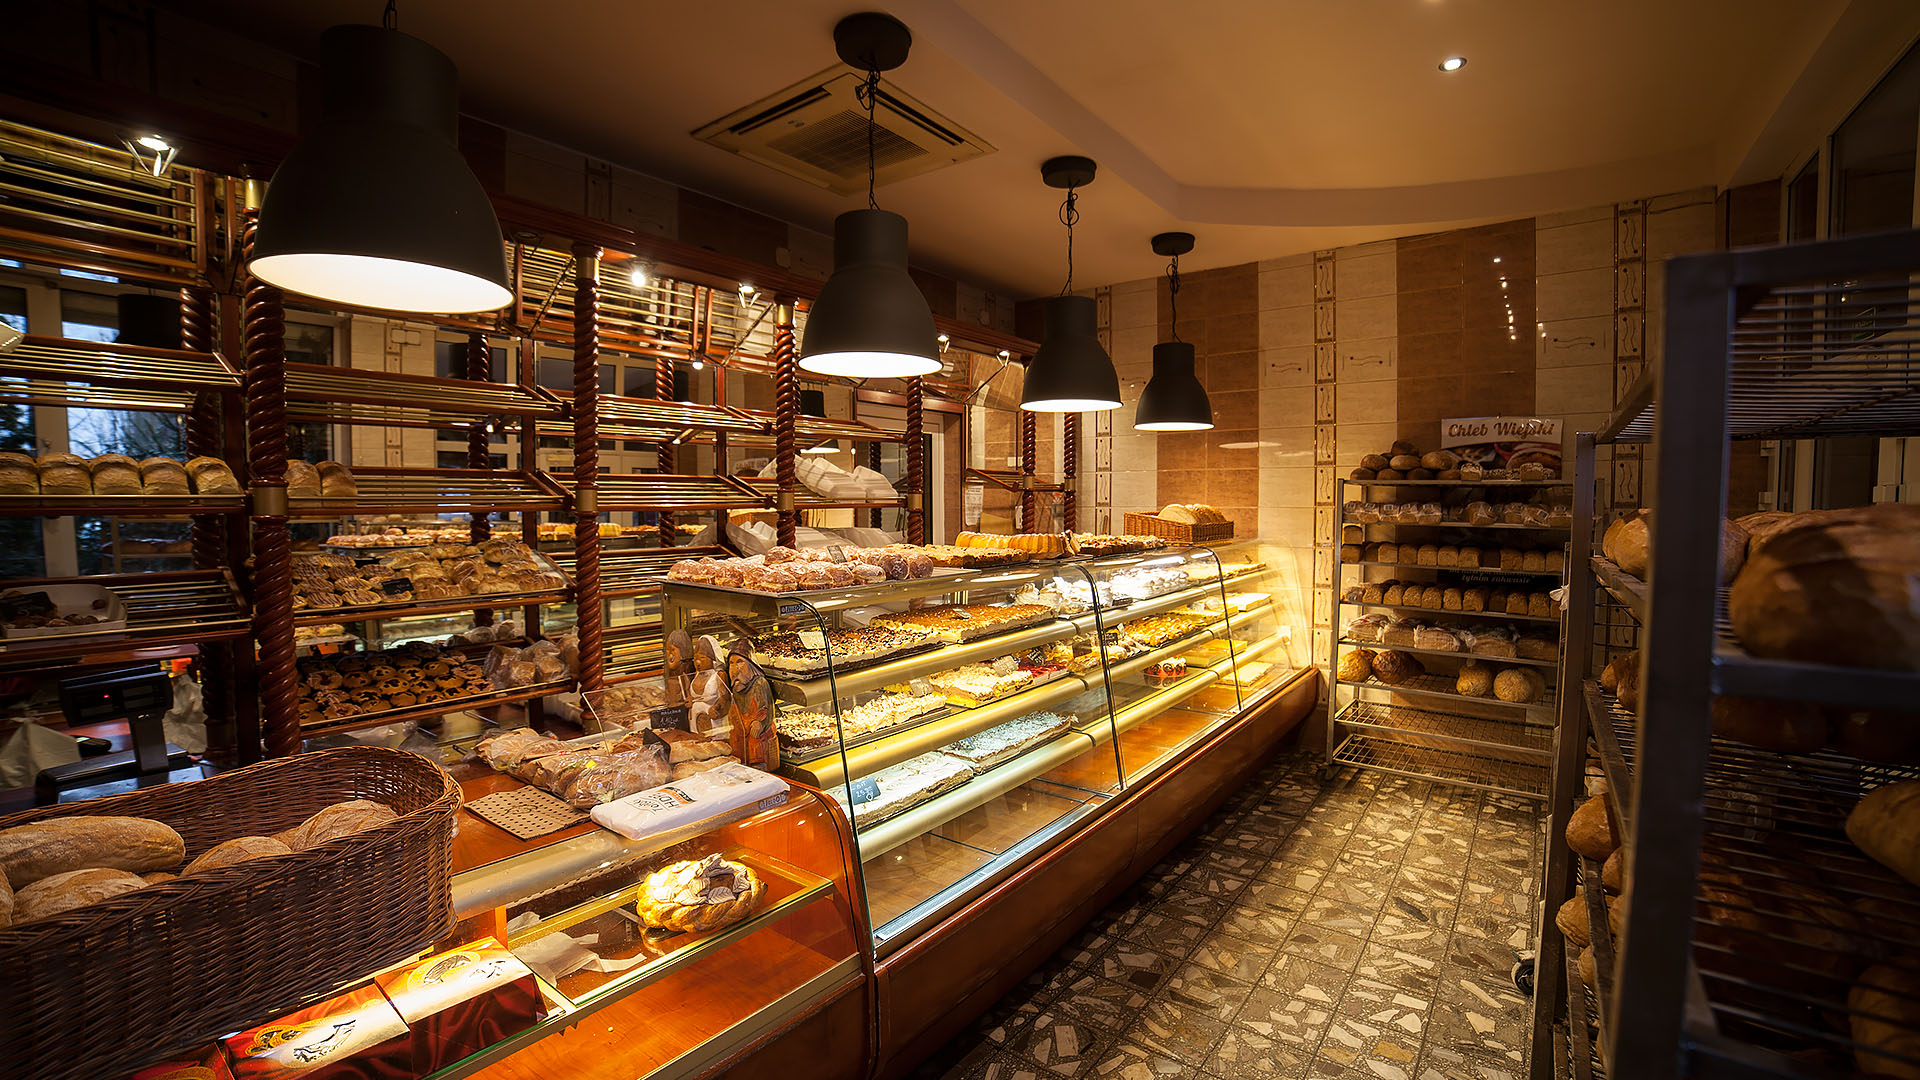 I was using quantity tools all my life. I established one person company where I realized orders associated with solve dilemmas, save costs and made optimizations. Bakery had problem with supply of their products. There were small retail net where sale bread and other bakery products. All shops were localized near the railway stations. The business was organized that: people commute to work and pass by shops and buy bread. There were no problem in the early morning. Bakery could send all products and all will be sold to the end of the day. The problem appears on the second shift. How many products we need to supply on second shift? There were 16 shops. When bakery send to many breads part of them would be thrown out. When send not enough customers will be angry. Bakery management remarked some regularities.
I used ordinary linear regression for each product. Independent variables were localization, day of week, weather and factor of long weekend approaching. Production managers got something like calculator based on linear regression. They put variables and got quantity of needed products by localization. All was working on the Excel, data was from the shops sales registry, calendar and local weather history. To see more.
Supermarket chain
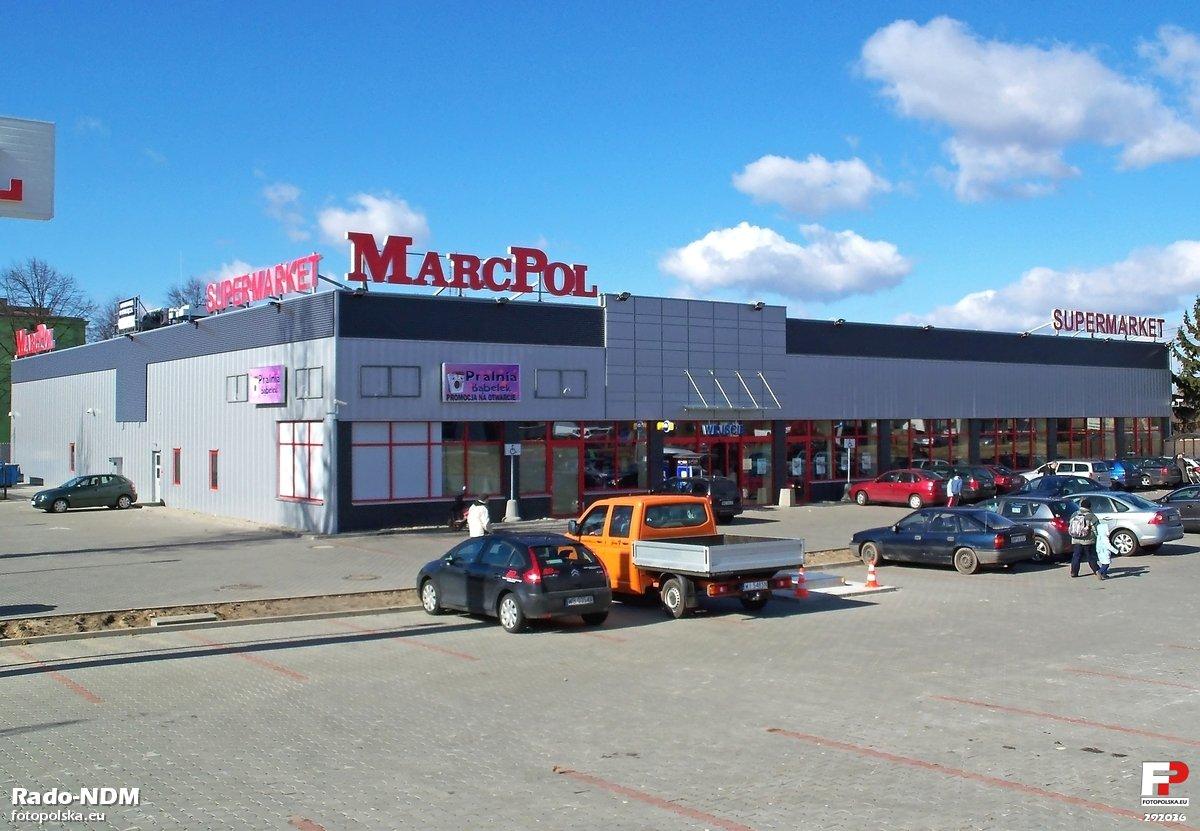 I wrote about this calculator in some newspaper and somebody read it. I got new order: optimize existing algorithm of ordering fresh products: chickens, meat, fruits and fish. It was big retail net consisted of 80 medium supermarkets. The company had no logistic center, external stocks and own fleet of vehicles. All products were ordering in real time in producers and wholesalers. It was the reason, why algorithm of order submission algorithm was so important. Supermarket chain incurred losses because bad working algorithm. Regularly there were throw out tons of spoil food.
I organized team of experts consisted of computer scientists and buyers. I use the same linear regression model like in bakery. Corrected algorithm was working better. Algorithm was working in the sales system of the company.
In this chain of retail I made one more project. The supermarkets sales system has no gauge informed about expiry of best before date for fresh products. I prepared such gauge in excel. It was automatically sending list of index of soon expire of best before date index to each of 80 shops every day. This program I wrote in Excel macros on the base of stock registry.
Kronospan
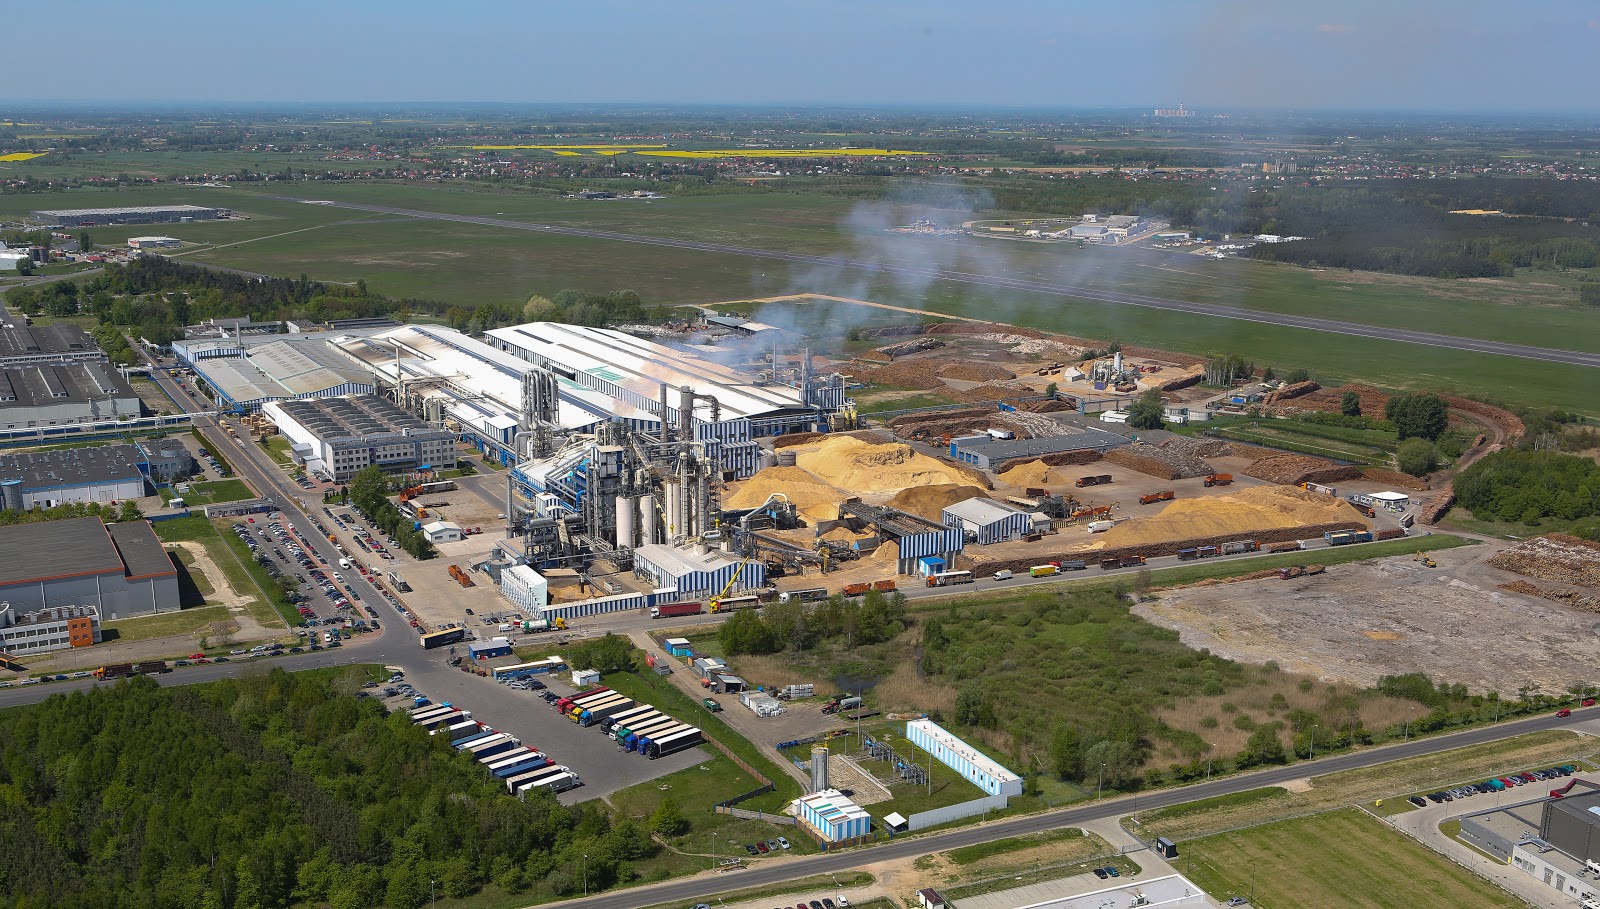 I was recruited by Kronospan, famous and successful producer of chipboard. They looked for somebody who would be able to take control on logistic process. It was very complex logistic process.
Main production Kronospan in Poland take place in 3 plants. Continuous 24 hours production. Thousands of index of products. Every plant was sending about one hundred vehicles with a goods a day. Huge technological lines need continuous raw materials flow. Ten wood yards were continuous receipting wood, process them and send to the main plants. There were 8 group of raw materials and thousands of raw index and hundreds of suppliers. Each plant received more over 150 trucks with the wood. We had more over 300 own vehicles and 500 external transporters. I was control all: weight, mas, contamination, rates for transport, fuel consumption, leasing, time of loading. I was also obligated to control all flow of goods to customers. I was monitoring stocks, delivery times, transport rates and most laborious subject: damages in transport. I tracked down anomalies, fraud and mistakes. It was independent position. I started with Excel but after month in main registry I had 1 million records for 80 columns. Excel was unable to work in such scale with logical formulas and pivot tables. I used Python (most frequently Pandas library) and MiniTab.
I was using extremely basic algorithms for the astronomical scale.
Generally as the first tool I was using simple searching maximum and minimum for each of thousands factors.
Second tool used for the mass scale was the theory of probability and normal distribution to evaluation of phenomena and anomaly detection.