
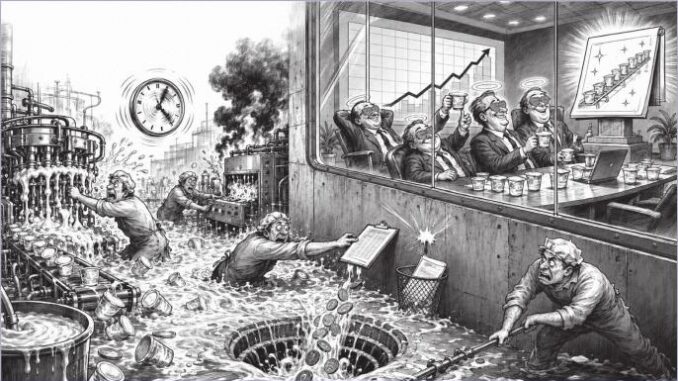
What Happened on the Production Floor Stays on the Production Floor
Why a food plant does not know how much its product really costs—and what must change in the document flow for it to find out
In most food-processing plants, a product-cost calculation is prepared once—before production begins—and is never, or perhaps almost never, compared with what happened on the production floor. The spreadsheet says that a cup of yoghurt costs PLN 1.27. The batch that came off the line last Tuesday cost PLN 1.46. No one calculated the difference because there is no document that would calculate it. This article describes how to build the return path—a form of feedback—how much its absence costs, and why an accounting method that is correct in the plastics industry leads a dairy plant to false conclusions about downtime.
1. The spreadsheet that ceases to be true on the day of production—in other words, what happened afterwards on the production floor stays on the production floor
The diagnosis sounds banal, yet it is the source of most misguided pricing decisions in the industry: information in a food plant flows in one direction. From the top down. The sales department accepts an order from a retail chain, the technologist issues a recipe, controlling calculates the price, the planner arranges batches on the lines, the shift supervisor receives a printout, and the operator fills the cups. And that is where it ends. What happened afterwards on the production floor stays on the production floor.
What the operator knows—that the filler ran more slowly, that the sealing machine stopped for an hour, that cleaning took three and a half hours instead of two—stays on the production floor. At most, it goes into the shift logbook, which no one reads anyway. This information never reaches the costing spreadsheet. And that spreadsheet, containing theoretical considerations never confronted with reality—a theory from six months ago—is the basis for calculating production costs for the following year.
The consequence is arithmetic, not emotional. The calculation does not lie on the day it is created—it lies on every subsequent day. Milk becomes several dozen groszy more expensive per litre, a new cup format requires a longer changeover, seasonal raw-material quality increases rejects. Every one of these events is documented in the plant: there is an invoice, a shift report, a protocol. None of them has a return path to the number on the basis of which the price was set. Someone lost an element of the mould being changed over and everything took longer; someone else had a weaker day. The organization does not learn. The organization relies on faith. Let us call things by their proper name: the problem is not that the plant cannot calculate. The problem is that there is no document that closes the loop. Without feedback, there is faith in theoretical values.
2. Anatomy of a calculation: six components and one hour
Before calculating a variance, there must be a point of reference. Technical manufacturing cost (TKW) consists of six items, and the list is not arbitrary—it follows from the definition of manufacturing cost in Article 28(3) of the Polish Accounting Act, which refers to direct costs and the “justified portion of indirect production costs”. Administrative and selling costs are not included in TKW and must not be included in it.
The six components, always calculated per one good unit—not per unit produced—are:
- Direct materials—variable costs: raw milk, milk powder, bacterial cultures, sugar, fruit preparation.
- Direct labour—again, variable costs: the crew operating the line during the hours for which the line is occupied.
- Machinery cost: depreciation, energy, utilities and inspections—calculated using the line’s hourly rate.
- Production preparation: in a dairy plant, primarily CIP and product changeover.
- Other direct costs: unit and bulk packaging, labels and film.
- The justified portion of indirect production costs—fixed costs: maintenance, the laboratory, departmental supervision and the cold store.
The key methodological decision concerns the third and sixth components: how should costs that cannot be assigned directly to a cup be allocated? In a plant with a clear bottleneck—which the production line’s capacity undoubtedly is—the only correct answer is by an hour of line operation. On that line, the hourly rate must be divided into three parts: machinery, labour and indirect costs. This later makes it possible to assign every variance to a specific hour and a specific cause. The word “variance” has appeared, even though the premise was that variances were not being collected. What happened on the production floor stays on the production floor. I am showing how this should look and why feedback is so important.
For a yoghurt filling line, I assume a full rate of PLN 620 per hour: machinery PLN 300/h, labour PLN 190/h and departmental indirect costs PLN 130/h. These are model values of the appropriate order of magnitude. Mathematically:
PLN 300 + PLN 190 + PLN 130 = PLN 620/h
This PLN 620/h does not include the yoghurt itself, packaging or material losses. It is the full rate for the line’s operation, not the full cost of the product.
Line operating time is a marginal item—let us fight over the price of milk; or, how to miscalculate the initial calculation for 400 g natural yoghurt
Recipe and planned parameters: 0.39 l of raw milk at PLN 2.10/l, 12 g of skimmed milk powder at PLN 14.50/kg, bacterial cultures at PLN 0.0120 per cup, packaging (cup, lid and label) at PLN 0.1350, line capacity of 12,000 cups/h, planned CIP1 and changeover of 2.0 h per batch, normative losses of 2.0%, and a batch size of 24,000 cups.
| TKW component | PLN/cup | Share |
|---|---|---|
| Direct materials | 1.0255 | 80.9% |
| Packaging | 0.1378 | 10.9% |
| Production preparation—CIP | 0.0408 | 3.2% |
| Machinery cost | 0.0255 | 2.0% |
| Indirect production costs | 0.0219 | 1.7% |
| Direct labour | 0.0162 | 1.3% |
| PLANNED TKW | 1.2677 | 100.0% |
At a selling price of PLN 1.58, this gives a margin of PLN 0.3123 per cup and a mark-up of 24.6%. The entire batch should generate PLN 7,495.
The structure of this table leads to a false conclusion. The four items connected with line operating time—machinery, labour, CIP and indirect costs—add up to PLN 0.1044, or 8.2% of the cost of a cup; raw material and packaging account for more than 91%. The natural conclusion is: line operating time is a marginal item, so let us fight over the price of milk. I will show below why this is the most expensive mistake that can be made when reading an absorption-costing calculation.2
1 In a dairy plant, CIP usually includes rinsing the line, cleaning with chemicals, disinfection and final rinsing. In this example, CIP and changeover take a total of two hours per batch. During this time, the line is not producing, but machinery, employee and departmental costs are still incurred. This is why CIP time must be added to the batch cost.
2 Absorption costing is also known as full production costing. The product “absorbs” all production costs: materials and packaging, direct labour, machinery costs, and variable and fixed departmental indirect costs. Example: a dairy plant incurs PLN 50,000 of fixed departmental costs and produces 100,000 cups of yoghurt. Each cup absorbs PLN 0.50 of those costs. Thus, absorption costing shows the full manufacturing cost of the product, not only variable costs. Selling and general administrative costs are normally not included in manufacturing cost.
3. Eight reasons why a batch costs more
The variance between actual and planned cost is not one number and must not be presented as such. It is the sum of the effects of many independent events—specifically, eight variance drivers—each of which has a different owner in the organization, a different source document and a different corrective path. The complete list of drivers, in the order in which they must be settled, is as follows.
Material price. The raw material became more expensive after the calculation was prepared. In a dairy plant, this item changes every month and is a purely price-related variance over which production has no influence. Source document: purchase invoice.
Losses and rejects. More unsuitable units than the standard assumed: underweight units, a leaking seal, rejection by the metal detector, mechanically damaged cups, or product held by the laboratory. This is a quantitative material-usage variance. Documents: shift report and inspection protocol.
Line capacity. The line ran more slowly than specified in the process sheet. Capacity variance. Document: shift report.
Downtime. Hours during which the line was occupied but nothing came off it—a failure, lack of packaging, or waiting for raw material. This cost driver must have a mandatory cause field. Downtime without a cause can be posted, but nothing can be done about it.
Changeover and CIP. Cleaning, disinfection, and a change of flavour or format. This is a cost that does not produce a single cup, yet in a dairy plant it is unavoidable and high. It is a classic batch-level driver: it depends not on the number of units, but on the number of runs.
Tooling and failures. Servicing and accelerated wear of heads, knives and sealing dies. The driver is the number of cycles, not time.
Packaging. A change in the price of the cup, lid or carton, or increased consumption during start-up.
Volume. Fewer good units were produced than planned, so costs independent of batch size—primarily CIP—are spread over fewer cups. This variance arises even when no one has done anything wrong. It is most often omitted and most often confused with inefficiency.
Eight drivers, eight different corrective conversations. Reducing them to one item—“cost overrun of 15%”—destroys all the information they carry.
4. The calculation: a batch of natural yoghurt, Tuesday shift
Let us take a batch from circumstances far removed from a disaster—no critical failure, no contamination, no laboratory hold. An ordinary Tuesday shift with a few minor issues:
- the price of raw milk increased from PLN 2.10 to PLN 2.28/l; the invoice arrived from the previous week;
- losses increased from 2.0% to 4.6%; the cause was underweight units after start-up and a series of leaking seals;
- the line produced 10,400 cups/h instead of 12,000;
- 1.2 h of downtime; cause: sealing machine, die replacement;
- CIP and changeover took 3.5 h instead of the planned 2.0 h;
- 22,100 good cups were produced instead of 24,000.
In other words, everything fell apart—and do you still think it is right that what happened on the production floor stays on the production floor?
| TKW component | Plan | Actual | Change |
|---|---|---|---|
| Direct materials | 1.0255 | 1.1270 | +0.1015 |
| Packaging | 0.1378 | 0.1415 | +0.0037 |
| Production preparation—CIP | 0.0408 | 0.0776 | +0.0368 |
| Machinery cost | 0.0255 | 0.0465 | +0.0210 |
| Indirect production costs | 0.0219 | 0.0407 | +0.0188 |
| Direct labour | 0.0162 | 0.0295 | +0.0133 |
| TKW | 1.2677 | 1.4629 | +0.1952 |
The cost of a cup increased by 15.4%. With the price unchanged at PLN 1.58, the margin fell from PLN 0.3123 to PLN 0.1171. The batch generated PLN 2,588 instead of PLN 7,495—PLN 4,907 disappeared, or 65% of the expected profit. The product is still profitable, and this makes the case more dangerous than an overt loss: nothing turns red, the monthly statement balances, and the plant systematically gives away two thirds of its margin without knowing where.
Now the most important point—the breakdown of that PLN 0.1952 by cause:
| Driver | Impact | Share | Owner |
|---|---|---|---|
| Milk price: PLN 2.10 → PLN 2.28/l | +0.0716 | 36.7% | Purchasing |
| CIP: 2.0 → 3.5 h | +0.0388 | 19.9% | Planning, maintenance |
| Losses: 2.0 → 4.6% | +0.0351 | 18.0% | Production, quality |
| Downtime: 1.2 h—sealing machine | +0.0310 | 15.9% | Maintenance |
| Volume: 24,000 → 22,100 units | +0.0104 | 5.3% | Secondary effect |
| Capacity: 12,000 → 10,400/h | +0.0083 | 4.3% | Technology |
| TOTAL | +0.1952 | 100.0% |
This table is the whole point of the undertaking. It does not say “costs increased by 15%”. It says:
- one third of the variance is the price of milk, over which we have no influence this quarter, but which we are entitled to transfer to the price list;
- one fifth of the variance is cleaning that took one and a half hours too long—a subject for a planning meeting;
- one fifth is sealing losses—a matter for maintenance and quality.
Three conversations, three departments, three deadlines. There is surely something to discuss.
For a salesperson, one number follows from this: if the 24.6% mark-up is to be maintained, the price that restores profitability is PLN 1.8228. This is not a demand to send to the retail chain, but a reference point in negotiations and a measure of how much must be recovered on the process side if the price cannot be increased.
5. Why “other” cannot be an item in the table
It is worth pausing over the method, because this is where the boundary lies between a report that production trusts and one that it rejects.
It is tempting to calculate the effect of each factor separately: how much a cup would cost if only the milk price changed, then only the losses, and so on. The problem is that these effects overlap: higher losses mean more units processed and therefore more line operating hours, which are also multiplied by the higher milk price. The sum of effects calculated separately does not agree with the total variance, and the difference lands in an “other” item or is quietly attached to the largest category. People are only human; we have an evolutionary mechanism for conserving our own energy built into us. If we do not have to do something, we do not do it. If a cost report contains an “other” item, production stops trusting the whole table—and rightly so, because it is impossible to say who is responsible for “other”. Evolution is one thing, but if we calculate incorrectly, there will be no money, there will be a loss, and eventually we will be pushed out of the market. Costs must be calculated properly.
The solution is the successive-substitution method known from economic analysis. We start with a fully planned vector and change exactly one driver at a time, in a predetermined order, recording the increase in cost after each step. After all eight drivers have been processed, the vector is fully actual, so the sum of the increments is equal to the total variance by definition—without a balancing value. In the table in the previous section, the six items add up to PLN 0.1952, which is also the difference between 1.4629 and 1.2677. Exactly—to four decimal places.
In this method, the order in which factors are taken into account matters. It does not change the total variance, but it affects the factor to which the shared portion of the cost is assigned. The order must therefore be established once, recorded in the cost-accounting principles and applied in the same way in every period. Here, external factors are taken into account first and internal factors afterwards. This immediately shows the costs for which production is not responsible. After all, every variance has its own cause.
6. An hour of line operation costs PLN 620 and is worth PLN 3,748—the biggest mistake in this story
Let us return to the table in the second section and to the conclusion it suggests.
The 1.2 h of downtime and the additional 1.5 h of cleaning burdened the batch with PLN 1,543—this is the sum of the “downtime” and “CIP” variances multiplied by the number of cups. Against the value of the batch, this is a minor amount. Absorption costing tells the director: 2.7 hours of stoppage cost us one and a half thousand zlotys. This is an accounting truth and an economic falsehood.
During those 2.7 hours, a line operating at nominal capacity would have produced 32,400 cups, each of which was supposed to generate a margin of PLN 0.3123. Lost margin:
32,400 × PLN 0.3123 = PLN 10,119
This is six and a half times more than the cost calculation indicates. The difference arises because the batch absorbs only PLN 620 for every hour for which the line is occupied, while one hour of line operation generates:
12,000 planned cups × PLN 0.3123 = PLN 3,748 of margin
The ratio of margin to hourly cost is 6.0.
| Indicator | Yoghurt line |
|---|---|
| Cost per hour | PLN 620 |
| Margin per hour | PLN 3,748 |
| Margin ÷ cost | 6.0 |
The conclusion runs counter to intuition: in food processing, the bottleneck is time, not cost.
The cost structure—81% raw material—suggests that the fight is over the price of milk. The margin structure says the opposite. A plant that shortens cleaning by half an hour per batch earns more than a plant that negotiates two groszy off the price per litre—and the former is entirely within its own control.
This leads to a decision-making rule when arranging the plan: the profitability of products must not be compared by percentage mark-up, but by margin per hour of line operation.
A product with a lower mark-up but a faster filling rate and shorter cleaning requirement can be worth more than the item with the highest percentage margin in the price list. A ranking prepared in the two ways produces a different order—usually the most surprising slide at a plant management meeting.
A methodological reservation: the margin calculated above is a margin over full cost, not variable cost, so formally it is not a contribution margin. This does not change the direction of the conclusion, but things must be named precisely.
7. What type of calculation is this—and why does a dairy plant need a hybrid?
A question that always arises when the conversation moves from the production floor to controlling is: what type of calculation are we dealing with?
The model described here is job-order addition costing under full costing, with indirect costs allocated using a machine-hour rate determined separately for each cost centre. The cost object is a batch, not a period. Standard costing with variance analysis is superimposed on it. Elements of other methods appear as aids: simple division costing appears within the batch—the cleaning cost is divided by the number of cups—while phase and coefficient costing are absent because the model was created for a single-phase process.3
And here we reach the only serious gap that must be stated openly: a dairy plant will not fit into pure job-order costing because it has two phases that differ in nature.
- Phase one—milk intake and standardization, pasteurization, inoculation and fermentation in a tank—is mass and continuous production; there is no batch here in the job-order sense, but a charge and time. The correct method is phase or process costing, whose result is the cost of a litre of starter culture. Dividing the product range—400 g and 150 g cups, natural and fruit yoghurt from one tank—requires coefficient division costing, in which the coefficient is the product volume or the amount of milk per package.
- Phase two—filling, sealing and packing—is batch production with changeovers, and therefore an environment for the job-order addition costing described in this article.
A dairy plant therefore needs mixed phase/job-order costing. Variance accounting and document flow transfer directly; the tank phase and two matters unknown to the plastics industry must be added: the use-by date and laboratory batch release. The latter matters in cost terms—a batch blocked for a day occupies the cold store and shortens its commercial life.
3 Single-phase means that it has only one phase—filling yoghurts.
When is activity-based costing worth considering?
The natural question is whether ABC should be implemented immediately. In the calculation presented here, indirect production costs are 1.7% of TKW and, even with full allocation of departmental costs, still below 10%. Activity-based costing pays for itself only when indirect costs are of the order of 30–40% and when a single allocation key genuinely distorts decisions. With a structure dominated by raw material, ABC is a cost with no return.
There is one exception, important in a plant with a fragmented product range: CIP is a textbook activity in the ABC sense, and its driver is not an hour of production, but the number of changeovers. A plant producing six short flavour runs a day incurs a cleaning cost many times higher than a plant producing two long runs. When everything is allocated only by hours, the difference is invisible and niche products are quietly subsidized at the expense of high-volume products. In the model described here, production preparation has already been separated as a component with its own driver, so this most important step towards ABC has been taken without the cost of a full implementation.
8. Document flow: what must return from the production floor?
The cost loop is not a software function. It is the route of a document. The following is the minimum set without which the calculation in section four cannot be performed—regardless of whether the plant maintains it in an ERP system, a dedicated application or a spreadsheet.
Downwards—from the order to the production floor
The customer order creates a production order and a raw-material requirement; the production order specifies the product, batch size, line and current version of the recipe and process sheet—the key word is “version”, not the name of the document; the material requirement and material receipt provide warning of what will run short before it does; the weekly plan reaches the production floor as a printout for the shift supervisor.
Upwards—from the production floor to the money. This is the part that is usually missing
The shift report is the document on which the whole calculation rests. The operator records only what they already know: good and rejected units, actual capacity, cleaning and changeover hours, downtime hours and cause, and a written comment. One approval should update five places at once: the actual batch cost, the date in the plan, the line operating counter, the note in the process sheet and the warehouse issue.
- The failure notification and service protocol change the equipment status and mark the plan as at risk, and release the block after repair.
- The correction protocol corrects quantities while preserving an audit trail of who made the correction and when.
- The actual-cost settlement closes the loop: it marks the existing calculation as out of date and provides the price that restores the assumed profitability.
- The purchase invoice updates the raw-material price in all calculations that use it—without waiting for someone to remember.
- The laboratory’s batch release card closes traceability.
Two practical comments are more important than the choice of tool. The shift report must be short—if it takes the operator more than three minutes, the data will be entered from memory and the calculation will be built on fiction; a six-field report completed reliably is better than a twenty-field report completed carelessly. Downtime without a mandatory cause field is useless information—and this is the one field for which it is worth insisting on validation that blocks saving.
The whole process fits into one sentence that is worth hanging in the controlling department:
plan → production floor → truth → price → new plan
| 1 | 2 | 3 | 4 | 5 |
|---|---|---|---|---|
| Retail-chain order How much and at what price |
Planned calculation How much it should cost |
Production plan Line, date, crew |
Production Shift report |
Actual cost Variances and their causes |
Closing element: update of the calculation and price list → back to the planned calculation
Figure 1. The cost loop—information flow in the plant.
| Step | PLN/cup |
|---|---|
| Planned TKW | 1.2677 |
| + milk price | +0.0716 |
| + CIP | +0.0388 |
| + losses | +0.0351 |
| + downtime | +0.0310 |
| + volume | +0.0104 |
| + capacity | +0.0083 |
| Actual TKW | 1.4629 |
Figure 2. Variance breakdown—from planned cost to actual cost. The milk-price factor is external; the remaining factors are internal. The increments total PLN 0.1952 per cup.
9. What does the cost loop not solve?
Reliability requires the boundaries to be stated.
- It will not replace cost accounting in the books. It is a management tool operating at batch and line-hour level; reconciliation with the accounting records is a separate task.
- It will not calculate a cost that no one has measured. If a plant does not record cleaning hours separately from production hours, no model will isolate the CIP cost. Implementation begins with measurement, not with a spreadsheet. What is measurable is managed.
- It will not replace a conversation. The table in section four indicates where to look—it does not say what to do. Whether the additional one and a half hours of cleaning resulted from a poor order sequence, a faulty valve or the crew’s caution is determined on the production floor. What happens on the production floor should become part of the plant’s experience and wisdom.
- It does not work without trust. If the operator concludes that the report is being used to hold them accountable for mistakes, data quality will deteriorate within two weeks. One falsified measurement will destroy the whole calculation, especially with small margins.
- Most importantly: the actual price is not a pricing demand. The figure of PLN 1.8228 is information, not a decision. The decision may be: we raise the price, we improve the process, or we knowingly keep the product below profitability because it supports a contract for other items. All three are legitimate. Only the fourth—not knowing—is illegitimate.
The point is that calculating PLN 1.8228 does not automatically mean “we must sell at PLN 1.8228”. This figure only shows the product’s economic situation. On that basis, the company makes a decision:
- it raises the selling price;
- it lowers costs or improves production;
- it knowingly sells this product at a loss because it earns money on other products in the contract.
The worst situation occurs when a company sells below cost and does not even know it. Note: if PLN 1.8228 denotes cost, it is better to write “actual unit cost” rather than “actual price”.
10. Where should one start?
A checklist ranked by the ratio of effect to effort.
- Separate cleaning and changeover hours from production hours in the record of line operating time. Without this, there is no fourth component of TKW. Cost: a change to the shift report.
- Introduce a mandatory cause field for every stoppage. A closed list of five to eight causes plus a text field.
- Divide the line’s hourly rate into three parts—machinery, labour and indirect. This is a one-off controlling task that makes it possible to assign every variance to an owner.
- Calculate margin per hour of line operation for the entire product range and compare the ranking with the ranking by mark-up. This one comparison usually repays the cost of the whole undertaking.
- Establish and record the order of drivers in the variance breakdown—once and permanently.
- Introduce an actual-cost settlement document with one mandatory effect: marking the calculation as out of date.
- Link the purchase invoice to the calculation so that a change in the milk price updates every product that uses it.
- Finally—phase costing of the tank and coefficient allocation. This is the most difficult element and is not where one should start. It combines two methods of cost calculation. Phase costing of the tank means collecting costs for a specific batch of yoghurt in the tank, stage by stage: milk preparation, pasteurization, fermentation, cooling and filling.
The cost of the tank’s contents is then divided among the products manufactured. If different cups are filled from one tank, coefficients are used.
Example:
A 150 g cup receives a coefficient of 1.
A 300 g cup receives a coefficient of 2.
The larger cup therefore takes twice the share of the yoghurt cost from the tank. Packaging and additional operations are added separately.
Thus, the batch cost in the tank is calculated first and is then divided among the products. “Tank costing” is a practical term used in yoghurt production, not the official name of an accounting method.
Points 1–4 can be completed in a spreadsheet within a few weeks, and they deliver most of the effect. Points 5–8 are an argument for a dedicated tool.
Especially to illustrate this article better, I prepared an application that shows step by step how to calculate yoghurt production costs—from the cost of the batch in the tank to the TKW of individual products. The application is a demonstration version of a dairy cost-calculation system. It contains exactly the example presented here. Every entrepreneur can follow the calculations and see where the final product cost comes from.
The application is available at: https://milk.sigmaquality.pl/
Conclusion
Let us return to the figures with which we began. A cup was supposed to cost PLN 1.2677; it cost PLN 1.4629. The batch was supposed to generate PLN 7,495; it generated PLN 2,588. No failure, no contamination, no laboratory hold—an ordinary Tuesday shift with minor issues that occur every week. How many such Tuesdays might there be, and what happened on Monday? Does what happened on the production floor stay on the production floor?
And a question for the next management meeting: can we today, for any batch from last month, show these two figures side by side and break the difference down by cause? If the answer is “no”, every calculation in the plant is a historical document, not a management tool. Our production management is based on faith, not facts.
Closing the loop does not require an IT revolution. It requires one document that returns from the production floor to controlling, and one decision: the number in that document has the right to invalidate the spreadsheet.
Note. The calculation in the article is a model based on a functioning cost engine whose arithmetic accuracy is verified automatically—the sum of the variance breakdown agrees with the total variance to four decimal places. The filling-line parameters are model values of the order of magnitude found in medium-sized dairy plants; the comparative figures come from a calculation for an injection-moulded product. A reader who substitutes their own rates will obtain different amounts but the same directional conclusions. Everything can be followed in the demonstration application at https://milk.sigmaquality.pl/.
Wojciech Moszczyński
Wojciech Moszczyński—a graduate of the Department of Econometrics and Statistics at Nicolaus Copernicus University in Toruń; a specialist in econometrics, finance, data science and management accounting. He specializes in the optimization of production and logistics processes. He conducts research in the area of the development and application of artificial intelligence. For years, he has been involved in popularizing machine learning and data science in business environments.