
December 2020 | Przegląd Piekarski i Cukierniczy (Baking and Confectionery Review)
Data scientist in the bakery
In bakeries an important role is played by the proper management of current assets. Maintaining appropriate levels of stock and appropriate order sizes can significantly influence the plant’s efficiency. This article will concern an analytical method of determining the optimal size of purchases, called the Economic Order Quantity (EOQ). We will deal with calculating the optimal order size for the basic raw material in a bakery, which is flour.
To begin with, a few principles which it is worth recalling when looking for savings in the warehouse. The whole dilemma comes down to a simple question: what stock of flour should we have in the warehouse?
Is it better to have a full or an empty warehouse?
The answer seems obvious – one should have enough flour never to run out of it. It is hard to imagine a situation in which a notice is hung up in the shop: „No bread, because the bakery ran out of flour”.
Let us consider two extreme situations: when the warehouse is full and when the warehouse is almost empty.
W-MOSZCZYNSKI ppic 12-20When there is a great deal of flour in the warehouse, we have a greater guarantee that we will maintain continuity of production. A full warehouse is easier to manage, and this means that we do not lose time on frequently ordering and receiving the raw material. Unfortunately this also means a lot of unnecessarily frozen cash. A bakery should, after all, be characterised by a very fast cycle of monetary turnover.
In the economy a tendency can be seen towards maintaining small stocks. In most modern factories the production warehouses are very small; semi-finished products and raw materials are often ordered at the last moment according to the „Just in Time” principle.
So let us consider the second extreme situation, when there is very little flour in the warehouse. The bakery’s working capital is not imprisoned in stocks. Unfortunately, with small stocks the management of the warehouse becomes labour-intensive and expensive. One has to order and receive the raw material frequently, which of course costs money.
The level of stock
Let us imagine a bakery in which the stock level is replenished once every 3 months. The graph above represents the changes in the level of stocks during the year.
In this simple model the bakery always orders the same amount of flour at equal intervals of time, and the raw material is taken from the warehouse evenly. The blue line on the graph symbolises the average annual state of the warehouse. If we assume that the warehouse level is Q, we can calculate the average state of the warehouse as Q/2.
In a bakery warehouse we have several significant costs:
c₁ – the costs of ordering and receiving the raw material into the warehouse. This cost may consist of the costs of transporting the raw material, handling costs and the costs of office work. In practice the office costs connected with settling and receiving the transaction are ignored. Unfortunately, on a small scale they may constitute an important element of the costs.
c₂ – the variable cost of storage. This cost consists only of those costs which are connected with the quantity of raw material in the warehouse. These may include, among others, the costs of frozen capital, the costs of loss of the raw materials’ properties, or the costs of the risk of the raw material spoiling during storage.
Moreover there are two further significant elements of the equation: the average annual stock level Q/2, which on the graph has been shown as a blue dashed line, and the annual demand for the raw material R.
Optimising the size of one-off orders
Let us imagine a bakery which orders 13 tonnes of flour every month. Because of infrastructural constraints these are 25 kg sacks at 40 zł net apiece. Our aim is to optimise the size of the one-off orders.
The bakery therefore orders 520 sacks of flour every month; the bakery’s annual demand amounts to R = 6240 sacks.
The unit cost of an order c₁ amounts to 72 zł per sack. This cost consists of the cost of transport, the cost of receipt, the cost of repackaging and the costs connected with settling the transaction.
The variable cost of storing c₂ a sack of flour constitutes about 21% of the value of the raw material and amounts to 8.6 zł per sack annually. This cost includes, among others, the variable costs of the warehouse (7.5% of the value of the raw material), the costs of freezing working capital and the costs of loss of value of the raw material. The costs of freezing capital can be calculated by multiplying the average annual value of the warehouse by the annual return on working capital. Let us assume that the bakery has a 12% return on working capital. It should also be taken into account that during the year about 2% of the flour spoils.
We therefore calculate the variable cost of annual storage as the sum of products, where:
c₂ = k₁ × 0.075 + k₁ × 0.12 + k₁ × 0.02
k₁ – the unit value of a sack of flour,
0.075 – the annual cost of storing a sack of flour,
0.020 – the cost of loss of value of the flour during the year,
0.120 – the cost connected with the annual freezing of capital.
Instead of the return on working capital one may use the interest rate on a bank deposit. The aim is to indicate how much the money frozen in stocks could potentially have earned.
Substituting these values into the formula, we obtain an optimal order level of Q = 102 sacks. This means that it is more profitable to order flour 5 times a month than to keep a large stock of flour in the warehouse.
The total cost of running the warehouse
This cost can be calculated from the formula:
K(R) = c₁ · R/Q + c₂ · Q/2
Assuming an order size of Q = 102 sacks, the total annual cost of running the warehouse will amount to 879 zł.
If we assume that the bakery will receive Q = 520 sacks per month, the total annual cost of running the warehouse will amount to 2322 zł. By changing the way it is organised and the size of the orders, we save 1443 zł over the year. The savings are connected with an increase in the labour-intensiveness of the supply process.
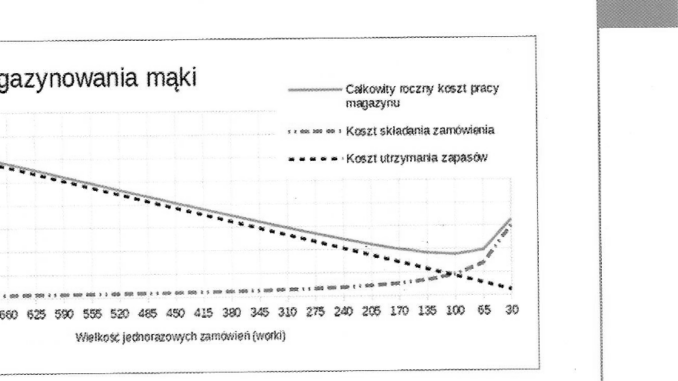
If we calculated all the possible variants of the order size Q, we would obtain the graph above. The optimal order level is located on the X axis at the intersection of the black dashed straight line of the cost of holding stocks and the red curve of the cost of placing orders. At this point the total annual cost of running the warehouse is the lowest.
Economic Order Quantity indicates the optimal level of order size. This is indicative information, because the values which have been substituted into the formulas are approximate in character. When the order size is reduced, the unit cost of transport and of receiving the raw material may change, among other reasons because of the cancellation of discounts for large purchases.
An analysis of the economic value of purchases may induce large bakery plants to move away from great orders made by means of flour tankers in favour of smaller deliveries. For many years there has been a move away from maintaining great production warehouses in favour of the dynamic management of small stocks according to the Just in Time principle.
Wojciech Moszczyński
Wojciech Moszczyński — graduate of the Department of Econometrics and Statistics of Nicolaus Copernicus University in Toruń; specialist in econometrics, finance, data science, and management accounting. He specializes in the optimization of production and logistics processes. He conducts research in the area of the development and application of artificial intelligence. For years he has been engaged in the popularization of machine learning and data science in business environments.
Dodaj komentarz