
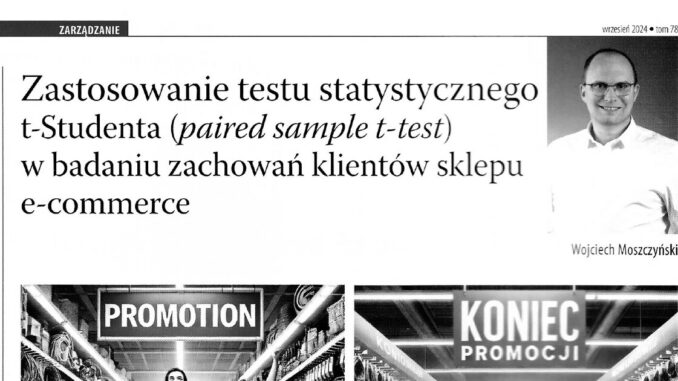
Data analysis can bring enormous benefits to e-commerce stores. The primary source of information about customer behavior in an online store is the register of their purchases. On this basis, we can observe how often customers visit the store, which products they choose, how much they spend, and we can even find out how they react to price changes. Analyzing individual customers in a database containing, for example, 100,000 records is not very effective. Special clusters are therefore created and customers are assigned to them.
W-MOSZCZYNSKI-2024-9-40Assigning customers to clusters
Imagine a situation in which we have an e-commerce technical wholesaler. Customers visit it and buy products from various categories. On the basis of the sales register, we can divide these customers into plumbers, plasterers, electricians and, for example, carpenters and bricklayers. With these five clusters, we can begin analyzing customer behavior within them. This allows us to observe that bricklayers visit more often than plumbers. Electricians are more sensitive to price changes, while plasterers leave the most money in the store.
This is, of course, a very simplified picture of data analysis. Thanks to detailed information, we can create an effective sales strategy and a well-constructed promotion for each cluster.
The question arises: how should the behavior of these five specific customer groups be compared? The analysis should be conducted using statistical t-tests. Three types of t-test can be distinguished. We will devote the next three publications to them.
The history of Student’s t-test
Student’s t-test, usually also called the t-test, is one of the most important statistical tools used in statistical data analysis. Its creator was William Sealy Gosset, a student who worked at the Guinness brewery. Gosset had to publish his discoveries under the pseudonym “Student” because of the strict restrictions that the brewery imposed on its employees. At the beginning of the twentieth century, the brewing industry used many modern techniques that gave a competitive advantage to companies possessing the appropriate know-how. The brewery attached great importance to protecting information concerning production processes, recipes and quality analyses.
To meet the conditions imposed by Guinness, Gosset decided to publish his discoveries under a pseudonym. In this way, he protected the company’s interests because his real name was not connected with the publication, making it impossible to identify him as a Guinness employee. And so someone whose name might have stood alongside Gauss, Thomas Bayes or Isaac Newton was remembered in history as “Student”; well, that is simply how things sometimes turn out.
He remained in the shadows, even though his test—initially noticed by only a handful of statisticians—gained recognition over time and became one of the most important data-analysis tools in the world.
Gosset’s discovery was groundbreaking. The t-test made analyses on small samples possible, which was invaluable not only in the brewing industry, but also in medicine, biology, psychology and many other fields in which studies on large datasets often cannot be conducted. Thanks to this test, it became possible to draw conclusions about differences between groups even on the basis of limited data.
Analysis of the electricians’ cluster
As I mentioned, the analysis of customer behavior on an e-commerce store platform consists in analyzing the sales register. Every transaction is analyzed in relation to the objectives set by the organization. Customers are not analyzed individually; instead, they are grouped into clusters. In our example, we assigned customers to five occupational groups. Importantly, customers can also be analyzed within a cluster by creating and comparing separate internal groups.
Let us assume that we have an electricians’ cluster. Within this cluster, we can distinguish, for example, customers who buy a lot and those who buy little. We can divide them into companies from large and small towns and continue looking for special characteristics in the subgroups.
Imagine that the owner of an e-commerce store decided to investigate how customers in the electricians’ cluster react to a reduction in the number of promotions. Store employees had noticed that small customers react more strongly to promotions than large companies do. This interested the owner, who decided to investigate it. He divided the companies into small businesses employing no more than one or two people, and large businesses employing more than two people and spending much more money. The process is easy to carry out when the sales register is analyzed. Having two customer groups within the electricians’ cluster, the owner therefore decided to find out which group of customers would be sensitive to a decline in the number of promotions. The possible conclusions from such a study may be crucial to the creation of an effective sales strategy. If, for example, small companies proved sensitive to product prices, the decline in the number of promotions would have to be cushioned by giving small companies individual discounts.
In general, the owner of the e-commerce company had already decided to reduce the number of promotions because they had a significant effect on the condition of his enterprise. At the same time, he wanted to prevent customers from leaving his e-commerce store.
How should the correct t-test be selected?
The task is to perform an analysis to determine in which group—small or large companies—the restriction of promotions had a significant effect on the volume of purchases. We will use an independent Student’s t-test (unpaired t-test) to compare whether the decline in the number of purchases after the restriction of promotions was introduced is significant for one of the groups.
This test is not difficult; it is just one line of code. It must be remembered, however, that the correct t-test has to be selected. There are three types of t-test:
- One-sample t-test (a t-test for one sample)
- Unpaired t-test (a t-test for independent samples)
- Paired-sample t-test (a t-test for dependent samples).
We use a one-sample t-test when we want to compare the mean from one sample with a specified value, such as the population mean. For example, we check whether the mean expenditure of the electricians’ cluster differs from the overall mean expenditure of all the store’s customers.
We use an unpaired t-test when we want to compare the means of two independent groups—that is, groups that are not connected with one another. We compare the mean expenditure of the electricians’ cluster with that of the carpenters’ cluster. We can also compare the mean expenditure of female electricians and male electricians. Both groups consist of electricians, but they are independent of one another.
A paired-sample t-test is used when we want to compare means for the same units at two different times or under two different conditions. We compare test results for the same group of electricians before and after training to determine whether the training affected their use of occupational-safety procedures.
In our example, the company owner wants to determine which electrical companies—small or large—are sensitive to a restriction in the number of promotions. Small and large companies are two separate groups of customers that are not connected with one another. We track changes in the purchasing levels of the same companies before and after the promotions and also compare the overall differences between the two groups. Because we analyze the same companies before and after the promotions, we must use a paired-sample t-test.
Practical use of the paired-sample t-test
The paired-sample t-test measures the difference in results within the same group at two different times, making it possible to take into account how each unit (company) changed its behavior under the influence of the introduction or restriction of promotions. For each customer group separately—small companies and large companies—we formulate the following hypotheses:
Null hypothesis (H0): There is no significant difference in the volume of purchases before and after the introduction of the restriction on promotions.
Alternative hypothesis (H1): There is a significant difference in the volume of purchases before and after the introduction of the restriction on promotions.
The paired-sample t-test for two dependent samples is used when we want to compare two groups of dependent data—purchases before and after the promotion—and determine whether the differences between the means are statistically significant. This test assumes that the data are normally distributed and that the variances are approximately equal.
I load the appropriate libraries in the Python programming environment.
import numpy as np
import scipy.stats as stats
We assume that we have data concerning the number of purchases made by small and large companies before and after restrictions on promotions were introduced.
# Simulating data for small and large companies: purchases before and after reducing promotions
np.random.seed(42)

# Small companies: purchases before reducing promotions (mean = 22)
zakupy_przed_male_firmy = np.random.normal(loc=22, scale=5, size=100)

# Small companies: purchases after reducing promotions (mean = 18)
zakupy_po_male_firmy = np.random.normal(loc=18, scale=5, size=100)

# Large companies: purchases before reducing promotions (mean = 27)
zakupy_przed_duze_firmy = np.random.normal(loc=27, scale=5, size=100)

# Large companies: purchases after reducing promotions (mean = 26)
zakupy_po_duze_firmy = np.random.normal(loc=26, scale=5, size=100)
Because we have no historical data, we generate random data for our example. We generated the number of purchases made by 100 small companies and 100 large companies.
The first three weekly purchase means for large companies before and after the promotion are as follows:
zakupy_przed_duze_firmy[:3]
array([28.7889368 , 29.80392263, 32.41525622])

zakupy_po_duze_firmy[:3]
array([21.85502495, 23.1990948 , 29.73646803])
Paired-sample t-test for companies—a comparison of purchases before and after:
# Paired t-test for small companies (before vs. after the promotion)
t_stat_male, p_value_male = stats.ttest_rel(zakupy_przed_male_firmy, zakupy_po_male_firmy)

# Paired t-test for large companies (before vs. after the promotion)
t_stat_duze, p_value_duze = stats.ttest_rel(zakupy_przed_duze_firmy, zakupy_po_duze_firmy)

# Results
print("T-test results for small companies:")
print(f"t-statistic: {t_stat_male:.4f}, p-value: {p_value_male:.6f}")

print("nT-test results for large companies:")
print(f"t-statistic: {t_stat_duze:.4f}, p-value: {p_value_duze:.6f}")
T-test results for small companies:
t-statistic: 4.8003, p-value: 0.000006
T-test results for large companies:
t-statistic: 1.1296, p-value: 0.261372The paired t-test was conducted for the same companies before and after the reduction in promotions, which makes it possible to assess whether the change is statistically significant. If the p-value is lower than the significance level (α = 0.05), we reject the null hypothesis and conclude that reducing promotions had a significant effect on the number of purchases in that group.
In our example, small companies display a significant decline in the number of purchases after promotions were reduced; we know this because the p-value is < 0.05.
Large companies do not display a significant change, as the p-value is > 0.05, which means that they are insensitive to the reduction in the number of promotions.
Sensitivity to the end of frequent promotions
If the t-test for small companies shows a significant difference, this means that small companies are more sensitive to the absence of promotions, which may indicate greater dependence on discounts. In such a case, restoring or increasing promotions specifically for this group may be considered. Large companies are less sensitive to promotions, and their purchasing decisions are more stable regardless of price changes. For them, promotions can be eliminated without the risk of their leaving en masse.
If small companies respond to the absence of promotions with a significantly larger decline in purchases, this suggests the need to consider a special discount strategy for them in order to maintain their loyalty and purchasing activity.
Summary
The t-test is not very popular among data analysts. They often prefer to use highly complex analytical models, Shapley algorithms1 and complex methods for finding correlations. A lack of effective and simple statistical methods, however, may prove disastrous.
It should be remembered that the analysis of customer behavior on e-commerce platforms consists of thousands of small operations that, like a mosaic, create a true picture of customer behavior. If the owner of the e-commerce platform had decided to reduce the number of discounts, he would have faced a mass outflow of small entities from the electricians’ cluster.
Thanks to a simple t-test, however, he learned that the group of small companies was sensitive to the absence of promotions, thereby protecting his store from losses and the loss of customers.
On the basis of the results, it is possible to infer which customer groups react more strongly to changes in promotions. This made it possible to adapt the marketing and pricing strategy to companies of different sizes, increasing the effectiveness of promotional activities. In this way, we can better understand which customer groups in the e-commerce industry are more sensitive to changes in price-promotion policy and what actions should be taken to minimize the effect of such changes on sales.
1 https://jakbadacdane.pl/co-to-jest-shapley-additive-explanations-shap/
Wojciech Moszczyński — graduate of the Department of Econometrics and Statistics of Nicolaus Copernicus University in Toruń; specialist in econometrics, finance, data science, and management accounting. He specializes in the optimization of production and logistics processes. He conducts research in the area of the development and application of artificial intelligence. For years he has been engaged in the popularization of machine learning and data science in business environments.
Dodaj komentarz