
January 2022 | Przegląd Zbożowo-Młynarski (Grain and Milling Review)
DATA SCIENCE IN THE MILLING INDUSTRY
Modelling is the creation of a virtual environment which is to describe reality to some degree. This description is needed in order to understand the course of some process. Sometimes we create a model in order to observe some regularity, to catch certain anomalies or undesirable phenomena. We try to understand phenomena in order to be able to predict their course in the future.
Two approaches dominate in creating models:
— supervised model learning
— unsupervised model learning.
In this publication we will speak of supervised learning, which, greatly simplified, consists in training the model on a training set and checking the effects on a test set. The first step in supervised learning is dividing the data set into a small test set and a large training set.
W-MOSZCZYNSKI pzm 1-22As is known, a typical data set consists of describing variables (also called independent variables) and of outcome data, that is, results describing the phenomenon. For example, the outcome might be the level of fuel consumed in a car, while the variables describing this outcome might be such information as the length of the route driven, atmospheric factors, load, or the speed at which the vehicle moved.
The model collects the describing data, analyses their magnitudes, compares them with the outcome values, and in this way learns the process, and finally is able to predict the theoretical level of fuel consumption. For the model to be able to generate results, it is enough to substitute the independent variables into it.
How to check whether the model worked correctly?
If we have only training data, the only way of checking the quality of the forecasts created is to use the model in practice. But what if we have 20 different models describing the same process? How can we find out which model is the best?
In order to assess the quality of models, the data set is randomly divided into a training set and a test set.* The model is trained on the training data. After the training is finished, the test independent variables are substituted into the finished model. The trained model receives describing variables not used before in the learning process, and on their basis generates theoretical results. The test set also contains empirical results, and we can compare them with the data which the model generated. In this way we can assess the quality of the modelling. This, greatly simplified, is how the supervised learning method works.
Overfitting the model
There are many different algorithms for modelling processes. Some of them have a low level of fit to the empirical results, but do not deviate significantly from them; other algorithms, in turn, have a tendency towards a very high level of fit to the empirical variables. In models which have a tendency to achieve a high level of fit of theoretical results to empirical ones, the problem of overfitting most often occurs.
A classic example of overfitting is a situation where the model perfectly reflects the phenomenon in the learning process, achieving a very high level of fit of the results based on the training data. At the same time, this same model, operating on test variables, shows a low level of fit of the theoretical values to the empirical results. An overfitted model is not suitable for use in practice. This is quite a common problem in the modelling process.
* One should not randomly divide sets which have the form of time series. In this case one should separate training periods and test periods.
How to eliminate the phenomenon of overfitting
There are many different methods of dealing with the phenomenon of model overfitting. These methods often depend on the type of algorithm and the characteristics of the phenomenon. Increasing the size of the training sample gives very good results, which is possible when we have a lot of data. In the process of creating a model, in practice all the data is used at once. Apart from this, overfitting often appears in a situation where there is really little data. Doubling a large quantity of data can practically bring no result at all.
Another method is simplifying the model’s algorithm, stiffening it, or stopping it at some moment in the convolution process. These ways of dealing with overfitting require a great deal of knowledge and practice, because they are carried out in the sphere of the model’s so-called hyperparameters. Such action most often consists in the method of changing the algorithm’s parameters on the basis of trial and error, which in itself is very time-consuming and gives no guarantees of success.
Chart 1. An example of changing the gamma hyperparameter of the SVM model.
Another method of eliminating model overfitting is the removal or addition of describing variables (feature elimination). The effectiveness of individual variables is verified, which is a long, complicated process burdened with a considerable risk of making an error. This method has very many variants because of the form of the independent variables and the outcome variables.
There is, however, a method of eliminating overfitting which is universal and possible to automate. This method is cross validation.
Cross validation
The cross validation method is closely connected with supervised learning. As we remember, in supervised learning we have to separate out from the data a large training set and a small test set. We also remember that overfitting is above all a poor fit of the empirical results to the theoretical results obtained from the model, calculated on the basis of the test data.
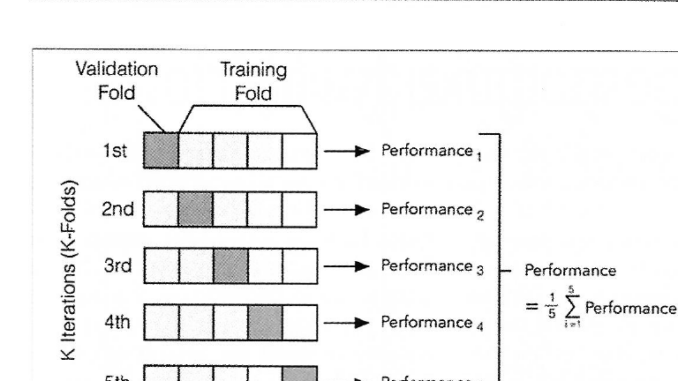
The cross validation method consists in making multiple divisions into test and training sets.
Chart 2. A scheme of how cross validation works.
In our example we will make five divisions of the data set. Each division is called a fold.
In the first fold, 20% is test data, the rest — training data. The model is trained on this training set, and then checked on the test data of the first fold. In this way the model finds out what errors it made in the first fold. Then a second fold is automatically created, where a further 20% of the data is separated out for testing. However, this cannot be the data which was in the test set of the first fold. The model repeats the process of training and testing for the data of the second fold. As many cycles take place as have been set in the tool’s hyperparameters.
Chart 3. The level of fit of the test set’s empirical variables to the theoretical data of the Extra Trees model.
Table 1. An example of the diagnostic printout of cross validation for the Extra Trees regression model.
ExtraTreesRegressor — cross_val, KFold = 9
R2: [0.92 0.92 0.92 0.91 0.94 0.92 0.91 0.92 0.92]
Mean_dev: [-30.6 -30.6 -32.1 -34.3 -29.4 -33.3 -32.5 -31.9 -30.1]
The application of cross validation
Cross validation can be used as a diagnostic tool which will indicate the level of a model’s quality; it can also be a method which will automatically eliminate overfitting.
In the example above, the study was carried out on nine folds. The first row denotes the parameter R², that is, the coefficient of determination of the regression for the test set. As can be seen, this parameter is quite high and stable, which testifies to the high quality of the model.
The second row of the table denotes the standard deviation statistic, which is also stable for all the validation folds.
Summary
At present the cross validation technique is the one most often encountered in the diagnostics and optimisation of data science models. There are many ready-made Python libraries which can easily be applied in the research process.
Wojciech Moszczyński
Wojciech Moszczyński — graduate of the Department of Econometrics and Statistics of Nicolaus Copernicus University in Toruń; specialist in econometrics, finance, data science, and management accounting. He specializes in the optimization of production and logistics processes. He conducts research in the area of the development and application of artificial intelligence. For years he has been engaged in the popularization of machine learning and data science in business environments.
Dodaj komentarz