
How to Extract Meaning from Data Overload: PCA, SVD and LDA in Managing a Modern Food Corporation
Today’s food industry operates in a reality in which information has become one of the most valuable strategic resources. Large food corporations no longer compete solely through product quality, price, logistics or brand strength. Increasingly, their advantage is determined by the ability to observe, understand and interpret sufficiently quickly the enormous streams of data arriving simultaneously from many directions.
These include information about competitors’ activities, customer behavior, changes in raw-material prices, conditions in commodity markets, commodity-exchange quotations, retail chains’ expectations, as well as macroeconomic and microeconomic phenomena that can affect the entire supply chain.
The scale of this challenge is enormous today. Companies must continually observe the market, analyze the dynamics of demand from supermarkets, and predict the consequences of changes in exchange rates, energy prices, transportation costs and fluctuations in supply resulting from weather, the geopolitical situation or local production disruptions. Added to this is less obvious but equally important information: changing consumer preferences, growing interest in particular types of food, pressure for cheaper, healthier or more environmentally friendly products, and signals from the media, industry reports and sales data. All of this creates a complex picture of the market that can no longer be analyzed effectively using only intuition, a manager’s experience or a simple spreadsheet.
The greatest problem is not merely that there is a great deal of data. The problem is that there is too much of it: it is dispersed, heterogeneous and often mutually contradictory. Some information requires an immediate response because it may indicate a risk of loss, supply disruption or loss of position relative to competitors. Other information proves to be noise that slows the decision-making process and obscures the picture of reality. What is more, at the outset it is often unclear which signals are genuinely important and which merely appear to demand attention.
This is why a modern food enterprise’s key competence is becoming not only the collection of data, but above all its intelligent organization, filtering, combination and reduction to a form that reveals what truly matters.
In practice, this means building analytical systems capable of separating important information from irrelevant information, detecting hidden relationships and indicating when additional data are required to understand a situation better. A seemingly trivial change in retail customers’ behavior may herald a larger trend. A slight movement in commodity-exchange prices may become the beginning of a stronger tendency. A single item of information about competitors’ activities, in turn, may acquire significance only when compared with data about raw-material costs, inventory levels and demand in the modern retail channel.
In the digital world, therefore, the advantage belongs not to those possessing the most data, but to those able to extract meaning from the excess. This is where methods for aggregating and reducing data become important. They help simplify a highly complex picture of reality without losing its most important content. In the food industry, where the number of variables may be enormous and decision-making speed directly affects sales, margins and operational security, tools such as PCA (Principal Component Analysis), SVD (Singular Value Decomposition) and LDA (Linear Discriminant Analysis) are becoming not merely academic subjects but practical support for business. They make it possible to organize data, reduce its dimensionality, extract the most important patterns, and support the classification and interpretation of market phenomena.
The importance of such methods grows with the digitalization of the entire sector. A modern food corporation now operates like a nervous system connected to hundreds of information sources. Data flow from ERP systems, sales platforms, commercial reports, exchange sources, production-planning systems, price monitoring, consumer analyses and many other channels. Without advanced analytical methods, it is easy to drown in this ocean of data instead of treating it as a source of competitive advantage. Intelligent information aggregation is therefore ceasing to be the exclusive domain of data-science specialists and becoming a genuine element of food-enterprise strategy.
In this article, we shall examine three important approaches to organizing and interpreting complex datasets: PCA, SVD and LDA. Although their names may sound technical, their role is highly practical: they help us see less chaos and more structure in data. In an industry in which every decision must simultaneously account for the raw-material market, customers, competitors, prices, logistics and demand dynamics, these methods support sound judgment, rapid responses and accurate decisions. Increasingly, these determine who in the digital world can not only survive, but build a lasting advantage.
PCA, or Principal Component Analysis
PCA is one of those methods that at first appears technical and academic but in practice answers a very simple question: how can we look at an enormous mass of data and stop seeing chaos, instead beginning to see order? In a large food company that observes commodity prices, transportation costs, supermarket behavior, delivery delays, inventory levels, promotions, complaints and competitors’ movements every day, information overload arises very quickly. There is so much data that people begin to lose their way in it. This is when PCA enters.
PCA does not yet predict an outcome; it does not immediately tell us how much we will earn or whether sales will rise. First, it does something different and highly valuable: it organizes our picture of the world.
Put most simply, PCA looks for groups of information that move together. Here an important term appears: covariance. It sounds serious, but its meaning is simple. Covariance tells us whether two things tend to move together. If one rises and the other usually rises as well, we say the data move in the same direction. If one rises while the other falls, they move in opposite directions. If they behave independently, they do not form a shared story. For an entrepreneur, the word “covariance” itself is unimportant; what matters is what lies behind it: the answer to the question of which indicators are actually telling the same story.
Imagine a simple situation. The price of wheat rises. Soon afterward, the cost of flour rises. Greater pressure on the margin then appears. At the same time, the plant begins to plan production more cautiously because it fears miscalculating costs. Retail chains put greater pressure on prices. We seem to be looking at several different figures, but all of them may be telling one story. PCA can notice this. Instead of leaving the manager with five separate charts, it shows that one larger mechanism, one principal force and one shared current of events is operating beneath them. That current is called a principal component.
The same can be seen clearly in transportation. Imagine a company delivering food products to retail chains. During a certain period, the number of delayed trucks rises, the number of urgent reschedulings—changes in delivery appointments—rises, the number of customer complaints rises and, at the same time, on-time delivery to shops falls. Someone may say: we have four separate problems. PCA may show something else: these are not four independent failures, but one larger logistical problem manifesting itself in several ways at once.
This is extremely important, because the company then stops fighting the fires separately and begins to understand where the true source of tension lies. Experienced managers naturally understand this. That is not the point. The point is for automated systems to relieve them of the work, so that everyone beginning a career can know and act as effectively as an experienced manager.
When we say certain data move in one direction, we do not mean a physical direction, but that they behave similarly. If supermarket orders rise when the number of promotions rises and inventory leaves the warehouse faster at the same time, these three things form a shared movement. If fuel costs rise but the number of store promotions sometimes rises and sometimes falls, with no visible relationship, these are separate stories. PCA exists to separate one story from another. It takes dozens of variables and tries to discover how many genuinely large, meaningful processes are operating in the background.
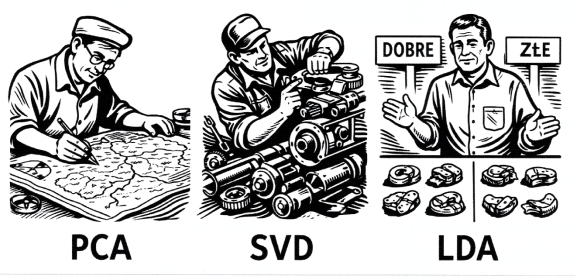
It can be compared with an operations director standing over a table covered with reports. One sheet contains raw materials, another transportation, a third sales, a fourth warehouses and a fifth complaints. Every report says something, but together they create noise. PCA acts like someone approaching the table and saying: all these papers actually show that three main things are happening. The first is cost pressure. The second is unstable demand. The third is logistical strain. Suddenly, chaos becomes a map. Once a map exists, decisions can be made.
This is where the business value begins. PCA does not make decisions for a human being, but it indicates very well where that person should look. If the data show that many indicators together form a strong component connected with raw-material, energy and transportation costs, management can secure contracts earlier, renegotiate prices or limit assortments with excessively weak profitability. If another component shows that instability in retail-chain orders is creating strain, safety buffers can be increased, promotions planned differently or data exchange with customers improved.
PCA does not say: do precisely this. It says: here is the real axis of the problem; here the data form a strong pattern; this is where the company should be especially vigilant.
It is also very important that PCA is an unsupervised method. It does not need a ready-made answer. We do not have to tell it beforehand what is success or failure, good sales or bad. It does not learn on the principle: I shall show you historical data and past results, and from current data you will guess the next result. PCA looks exclusively at the data themselves and asks: what are their principal arrangements, which variables overlap, which movements are shared and which are separate? It is rather like switching on a light in a dark room before looking for a particular object. PCA switches on the light. Only later do we decide how to use that knowledge.
This is why PCA is also useful before clustering. When a company wants to divide products, customers, regions or shops into meaningful groups, it is often unwise to do so immediately using hundreds of raw columns. First, it is helpful to simplify the picture and extract the most important dimensions of difference. PCA is often excellent for this purpose because it reduces the excess and reveals which observations are genuinely similar. Clustering is then performed on a more orderly picture of reality rather than on information noise. Before dividing the world into groups, it is useful first to understand its principal axes.
PCA did not arise yesterday. It is not a temporary fashion of the artificial-intelligence era. Its roots reach back to the beginning of the twentieth century, in the work of Karl Pearson and later Harold Hotelling. Although today it is used by data analysts and data-science teams, the idea is old and robust. People have long faced the same problem as modern companies: how to extract a few principal regularities from many figures. The digital world has merely multiplied the scale of the challenge.
In a food enterprise, PCA is therefore more than a statistical trick. It is a tool for organizing the world. It reveals that behind hundreds of indicators there are often only a few principal forces. Some concern costs, others demand, still others logistics or customer behavior. From a manager’s perspective, this is an immensely valuable change. Instead of examining dozens of tables, one can begin examining a few genuine mechanisms governing the business. When a company better understands which pieces of information move together and form a shared direction, it can distinguish signal from noise more easily, respond faster and make decisions based on structure hidden in the data rather than on chaos.
SVD, or Singular Value Decomposition
SVD also has a very interesting history. Its roots are older than many contemporary data-science tools. The idea dates back to the nineteenth century, when mathematicians studied matrix decompositions and sought ways of describing complex linear systems. The method developed further and over time became one of the foundations of modern linear algebra, data analysis, signal processing and machine learning. It is deeply rooted in mathematics and has now found immensely practical applications in the world of digital business.
Singular Value Decomposition is another method that helps organize an enormous information mess and extract several of its most important structures. PCA seeks the principal directions of variation in data and relies strongly on covariance. SVD may be regarded as an even more general and technical method. PCA looks at data somewhat like an analyst seeking to understand which features move together. SVD looks at data more like a mathematical engineer who dismantles a large table into several simpler parts and asks which principal patterns make up the entire picture.
For an entrepreneur, the difference may not be immediately perceptible because both methods often pursue a similar objective: reducing complexity and showing what truly governs the data. Their ways of thinking, however, differ slightly. PCA says: let us look for the principal axes of variation and see which pieces of information move together—sharing a movement and a story. SVD says: let us take a large data matrix, an enormous table, and decompose it into several simpler layers so that we can see which hidden patterns are strongest, which are weaker and which can be treated as noise or minor details.
This may sound abstract, but imagine a large food corporation with thousands of products, hundreds of shops, many sales regions and enormous tables showing how much of each product was sold in which place, during which week, at what price and promotion, and under what market conditions. Such a table is so large that a person sees nothing but a wall of figures. SVD acts like a tool for dismantling an enormous machine. It tells us to look calmly: this table does not contain a thousand independent stories. Certain patterns repeat. Some products behave similarly in many shops. Some regions purchase similarly. Some sales weeks share a character because they are promotional, seasonal or crisis periods. SVD helps decompose the chaos into several principal layers of meaning.
One may also imagine an enormous map of truck movements, orders and sales. At first glance, everything is mixed together. One truck drives to Warsaw, another to Łódź, a third to Kraków. Demand for flour rises here, demand for oil there, and for ready-made bread elsewhere. A manager sees congestion. SVD says that certain structures exist within it. The first and strongest pattern may show the general rhythm of large retail chains. A second may distinguish regions that are more price-sensitive from those that are less so. A third may show seasonality, and a fourth behavior connected with promotions. A structure begins to emerge from apparent chaos.
An important point must be explained. When discussing PCA, we said that data move in one direction—for example, grain cost, flour cost and pressure on price may rise together. PCA used the language of shared movement and covariance. SVD also seeks structure, but somewhat differently. It is not concerned solely with whether two columns rise together. It asks whether the entire large table can be described by several principal patterns. It is as though, instead of analyzing every truck separately, we checked whether the whole fleet operated according to several recurring schemes: one for deliveries to discount stores, another for hypermarkets and a third for small regional shops. SVD is excellent at discovering precisely this hidden architecture of data.
Consider a simple example. A company has a table in which products appear in rows, shops in columns and sales figures in the cells. Viewed ordinarily, it is merely thousands of numbers. SVD may reveal that three large patterns are operating underneath. The first says that some products sell well almost everywhere because they are staples. The second shows that certain products sell particularly well in urban shops but less well outside cities. The third shows that part of the assortment lives mainly through promotions. Instead of examining every product and shop separately, the company begins to see several principal market logics. That is highly valuable knowledge for decision-making.
This is where SVD becomes especially practical. Once a company sees that the data can be reduced to several dominant patterns, it can make more sensible decisions. It can construct product groups differently, detect deviations from the normal market rhythm faster and determine whether a sudden sales decline is a problem affecting one shop, one region or perhaps a break in a larger pattern. It can distinguish a large systemic phenomenon from a minor local disruption. In a large food corporation, this is immensely important because not every anomaly requires an alarm at management-board level. Sometimes it is only a little noise; sometimes it is the beginning of a larger change. SVD helps determine whether something belongs to the principal picture or merely the background.
In human terms, PCA resembles an analyst sitting at a table and saying: let us see which indicators move together, which form shared directions and what the principal axes of variation in the company are. SVD resembles a precision mechanic taking an enormous data machine apart and showing the most important layers from which it is built. PCA explains the world through variation and covariance. SVD explains it through decomposition of the whole table into principal patterns. For an entrepreneur, the most important fact is that both reveal less chaos and more meaning. PCA more often speaks the language of statistics; SVD, the language of data structure.
The two methods are closely connected. In practice, PCA is very often calculated using SVD. They are not two distant planets, but two different ways of describing a similar organization of the world. PCA speaks more about principal components and variance. SVD speaks more about decomposing a matrix into fundamental elements. From a business perspective, the result is often similar: an enormous quantity of data ceases to overwhelm and begins to arrange itself into several principal lines of interpretation.
In a food company, SVD may be particularly useful when data take the form of very large tables and relationships—for example, when we want to understand product-sales arrangements across retail channels, relationships between regions and assortments, supermarket-order patterns or similarities between sales periods. Where a person sees only an enormous matrix of figures, SVD can show the principal axes of hidden order. It then becomes easier to notice that certain product groups behave similarly, that some shops follow the same demand logic or that the market is beginning to shift toward a new behavioral pattern.
It may also be compared with listening to an orchestra. When an entire ensemble plays at once, an inexperienced listener hears only a loud, complex sound. An experienced person can distinguish the principal layers: melody, rhythm, background and instrumental entries. SVD does something similar with data. Instead of treating thousands of numbers as incomprehensible noise, it separates the noise into the main layers of the pattern. Its value in business lies not in providing a magical answer, but in enabling us to hear more clearly what is really playing in the data.
If PCA helps us understand which pieces of information move together and form principal directions of variation, SVD helps decompose the entire complex table of the world into its most important hidden patterns. Both serve the same purpose: reducing chaos and extracting meaning. In a modern food corporation, where decisions must be made quickly and there is more data than a person can comprehend, such methods are no longer academic curiosities. They become tools for survival, organizing reality and building an advantage over those who continue to look only at individual tables instead of seeing the larger pattern.
We shall now learn about a supervised method—a method to which we indicate the objectives.
LDA, or Linear Discriminant Analysis
Linear Discriminant Analysis marks the point at which we move from methods looking at the chaos of data itself to a method shown an objective. This is why it is called supervised. An unsupervised method such as PCA or SVD receives only a table of figures and must discover its principal arrangements, patterns and directions. LDA receives something more: we add information stating what each item is. We might say, for example, that these shops are stable and those unstable; these delivery batches ended in complaints and those were trouble-free; these products belong to the premium segment and those to a highly price-sensitive segment.
LDA therefore does not look at the world innocently or without purpose. From the outset, it knows which division we seek and consequently operates differently from PCA and SVD. LDA is explicitly described as a method of supervised dimensionality reduction that projects data onto directions maximizing separation between classes. It is also a classifier with a linear decision boundary. That sounds decidedly too complicated.
The simplest explanation is this. Imagine a large food corporation and hundreds of shops. We have abundant data about them: order volumes, number of promotions, delivery delays, margins, number of complaints, inventory turnover, share of fresh products and customer price sensitivity. PCA would ask which features in this enormous table move together and where the greatest variation occurs, thereby organizing the data landscape. SVD would decompose the table into several principal hidden patterns, like dismantling a large sales mechanism into basic layers. To use LDA, however, we must first say: these are the shops we consider “commercially safe,” and these are the shops we consider “risky.”
LDA then looks not for what is simply largest in the data, but for what best separates one class from another. This is the meaning of “supervised”: a human gives the method a direction, and the method seeks the best division according to that indicated objective. This is an important difference. People often think that all these methods do approximately the same thing, but the differences are enormous.
PCA may discover that the general scale of a shop’s activity plays the greatest role in the data: a large shop has greater turnover, more stock, more deliveries and more promotions. That information need not help distinguish a healthy shop from a problematic one; it may merely describe operating size.
LDA says: I am not interested solely in the greatest variation. I am interested in the direction that moves healthy and problematic shops as far apart as possible while keeping the shops within each group as compact as possible. In this sense, LDA is like a sales director asking: “What makes it easiest to distinguish good business from bad?” Mathematically, this intuition comes from maximizing between-class dispersion while limiting within-class dispersion. The contemporary formulation of LDA is also based on modeling class distributions and applying Bayes’ rule—put most simply, conditional probability.
Consider a simple truck example. Suppose a company assesses delivery routes every day and after some time knows which routes ended on time and which ended with delays and complaints. For each route, it has data on journey length, number of unloading points, time of day, traffic intensity, customer type, average stopping time and number of order changes.
PCA would try to discover which features normally move together. SVD would try to decompose the entire large table of routes into several principal logistical patterns. LDA receives ready-made knowledge: these routes were good and those bad. It begins looking for the combination of features that most cleanly separates the two. It may turn out that neither route length alone nor number of unloading points alone is decisive, but a combination: a long journey, many points, long stops and a customer who frequently changes the order. LDA can combine these ordinary-looking columns into a new axis that says very well: the risk zone begins here. This is operational, not merely descriptive, knowledge.
This is why LDA is so valuable when a company wants not merely to “understand data,” but to separate classes of phenomena: promising from unpromising shops, high-risk from low-risk batches, stable from unstable customers, regular products from strongly promotional ones, and deliveries susceptible or resistant to disruption. If PCA is a calm cartographer drawing a map of the data world and SVD a mechanic dismantling a large machine into its principal modules, LDA is an experienced quality manager saying: “Good, but let us finally show what distinguishes good cases from bad ones.” It does not settle for order alone; it seeks order useful for discrimination.
This shows why a supervised method is so tempting for business. PCA and SVD may discover very intelligent patterns, but there is no guarantee that they will be most important for a particular objective. The greatest variation in the data may involve seasonality or store size even though management most wants to understand complaints or declines in profitability. LDA immediately arranges the world around the indicated objective.
It is as if two people were looking at the same warehouse. One says: “Let us show the principal patterns of goods movement.” That is closer to PCA and SVD. The other says: “Let us show what distinguishes safe orders from those that end in trouble.” That is LDA. One approach is exploratory; the other is targeted.
A practical example comes from relationships with supermarkets. A company has data from hundreds of promotions and knows which were profitable and which merely inflated volume without meaningful profit. For each promotion, it knows the discount level, duration, shop type, region, season, display size, competing private-label share, delivery costs and volume of returns. PCA could discover the principal axes of promotional variation. SVD could show the principal hidden patterns of the promotional table. LDA receives the labels “profitable promotion” and “unprofitable promotion” and indicates the combination of features best separating one from the other.
In practice, such an axis may reveal that the most harmful promotions are long, offer deep discounts, run in a particular type of shop and coincide with rising delivery costs. This is material for a specific decision: which promotions to approve, which to cut and which to approve only conditionally.
It should be said honestly that LDA is not simply “better PCA.” That would be a misunderstanding. It is different. PCA and SVD are excellent when a company does not yet want, or cannot, impose one label and first wants to understand the structure of the world. LDA becomes powerful when the company possesses historical knowledge and can say: these cases were good and those bad; these belong to class A and those to class B.
Importantly, scikit-learn states that LDA reduces dimensionality to the most discriminating directions, and the number of these new axes is limited by the number of classes. It is therefore inherently a fairly strong form of dimensionality reduction.
Historically, the method’s roots derive from Ronald Fisher, the father of modern statistics, and his 1936 work on using multiple measurements to distinguish groups. It is an old, classical statistical tool that very early sought to answer the question: how can many features be viewed simultaneously so as to distinguish one group from another as effectively as possible? It finds a view of the data that not only simplifies the picture but, above all, sharpens differences important to the objective.
Summary
LDA completes this account of three approaches. PCA says: see which pieces of information move together and form the principal directions of variation. SVD says: let us decompose the great table of the world into several of its most important hidden patterns. LDA says: now that we know which division interests us, let us find the viewing axes that separate one class from another most effectively.
Each method has its place in a modern food corporation. Some help understand chaos, others help dismantle it, and LDA finally helps say: here runs the boundary between a safe and a risky case, between a healthy and a harmful promotion, between a stable customer and one requiring special attention. A supervised method is so valuable to business precisely because it does not merely organize the world; it organizes it for a specific decision.
Wojciech Moszczyński
Wojciech Moszczyński—graduate of the Department of Econometrics and Statistics of Nicolaus Copernicus University in Toruń; specialist in econometrics, finance, data science and management accounting. He specializes in optimizing production and logistics processes. He conducts research into the development and application of artificial intelligence. For years, he has been engaged in popularizing machine learning and data science in business environments.