Perfect Plots: Combiplot

In [1]:
import pandas as pd
import matplotlib.pyplot as plt
import numpy as np
import seaborn as sns

df = pd.read_csv('c:/1/WA_Fn-UseC_-Sales-Win-Loss.csv')
df.head()
Out[1]:
Opportunity Number Supplies Subgroup Supplies Group Region Route To Market Elapsed Days In Sales Stage Opportunity Result Sales Stage Change Count Total Days Identified Through Closing Total Days Identified Through Qualified Opportunity Amount USD Client Size By Revenue Client Size By Employee Count Revenue From Client Past Two Years Competitor Type Ratio Days Identified To Total Days Ratio Days Validated To Total Days Ratio Days Qualified To Total Days Deal Size Category
0 1641984 Exterior Accessories Car Accessories Northwest Fields Sales 76 Won 13 104 101 0 5 5 0 Unknown 0.69636 0.113985 0.154215 1
1 1658010 Exterior Accessories Car Accessories Pacific Reseller 63 Loss 2 163 163 0 3 5 0 Unknown 0.00000 1.000000 0.000000 1
2 1674737 Motorcycle Parts Performance & Non-auto Pacific Reseller 24 Won 7 82 82 7750 1 1 0 Unknown 1.00000 0.000000 0.000000 1
3 1675224 Shelters & RV Performance & Non-auto Midwest Reseller 16 Loss 5 124 124 0 1 1 0 Known 1.00000 0.000000 0.000000 1
4 1689785 Exterior Accessories Car Accessories Pacific Reseller 69 Loss 11 91 13 69756 1 1 0 Unknown 0.00000 0.141125 0.000000 4
In [2]:
SKS = df.pivot_table(index='Region',values='Sales Stage Change Count', aggfunc=['sum','mean']).reset_index()
SKS
Out[2]:
Region sum mean
Sales Stage Change Count Sales Stage Change Count
0 Mid-Atlantic 23050 3.045719
1 Midwest 61569 2.929068
2 Northeast 22247 3.023512
3 Northwest 27939 2.924937
4 Pacific 42636 2.815744
5 Southeast 28278 3.063042
6 Southwest 24902 3.054336
In [3]:
SKS.columns
Out[3]:
MultiIndex(levels=[['sum', 'mean', 'Region'], ['Sales Stage Change Count', '']],
           codes=[[2, 0, 1], [1, 0, 0]])

Merge column names

In [4]:
SKS.columns = ['_'.join(col) for col in SKS.columns.values]
SKS
Out[4]:
Region_ sum_Sales Stage Change Count mean_Sales Stage Change Count
0 Mid-Atlantic 23050 3.045719
1 Midwest 61569 2.929068
2 Northeast 22247 3.023512
3 Northwest 27939 2.924937
4 Pacific 42636 2.815744
5 Southeast 28278 3.063042
6 Southwest 24902 3.054336

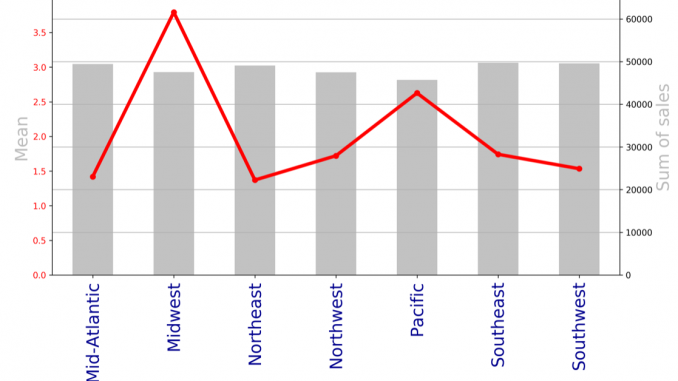
Combiplot

In [10]:
fig = plt.figure(figsize=(12,6), dpi= 280)

ax = SKS['mean_Sales Stage Change Count'].plot(kind="bar", color='darkgrey',alpha=0.7)
ax.set_ylim(0,1.3*SKS["mean_Sales Stage Change Count"].max())
ax.set_xlabel("Regions", color='darkgrey',alpha=0.8, fontsize=20)
ax.set_ylabel(r"Mean", color='darkgrey',alpha=0.8, fontsize=20)
ax.grid(False)
ax.tick_params(axis='y', rotation=0, labelcolor='red')
ax.tick_params(axis='x', rotation=90, labelcolor='darkblue')
ax.set_xticklabels(SKS['Region_'], rotation=90, fontdict={'fontsize':20})


ax2 = ax.twinx()
ax2.plot(ax.get_xticks(),SKS['sum_Sales Stage Change Count'],'--', marker='o', c='red', linewidth=6)
ax2.set_ylim(0,1.05*SKS["sum_Sales Stage Change Count"].max())
ax2.grid(True)
ax2.set_ylabel(r"Sum of sales", color='darkgrey',alpha=0.8, fontsize=20)
ax2.set_title("Sales by regions", fontsize=23, alpha=0.4)

plt.show()